How does prestige correlate with placement in academic philosophy? There’s good stuff on this already, like this post by Carolyn Dicey Jennings, Pablo Contreras Kallens, and Justin Vlasits.1 This post uses the same data sources, but emphasizes different things (visualization, North American PhDs, and primarily tenure-track jobs).
TT Placement in North America
Let’s start with a simple question of broad interest. In North America, how well does the PGR rating of one’s PhD-granting program predict one’s chances of landing a tenure-track (TT) job?
Consider all the people who got a PhD from a North American philosophy program in the years 2012–14.2 Focus for now on those from PhD programs ranked by the 2006 edition of the PGR.3 Now group them according to those PGR ratings, rounded to the nearest 0.5.
This gives us 7 groups of PhDs (rankings range from 2.0 to 5.0). According to the APDA’s data, the portion from each group who ended up in TT jobs are as follows:
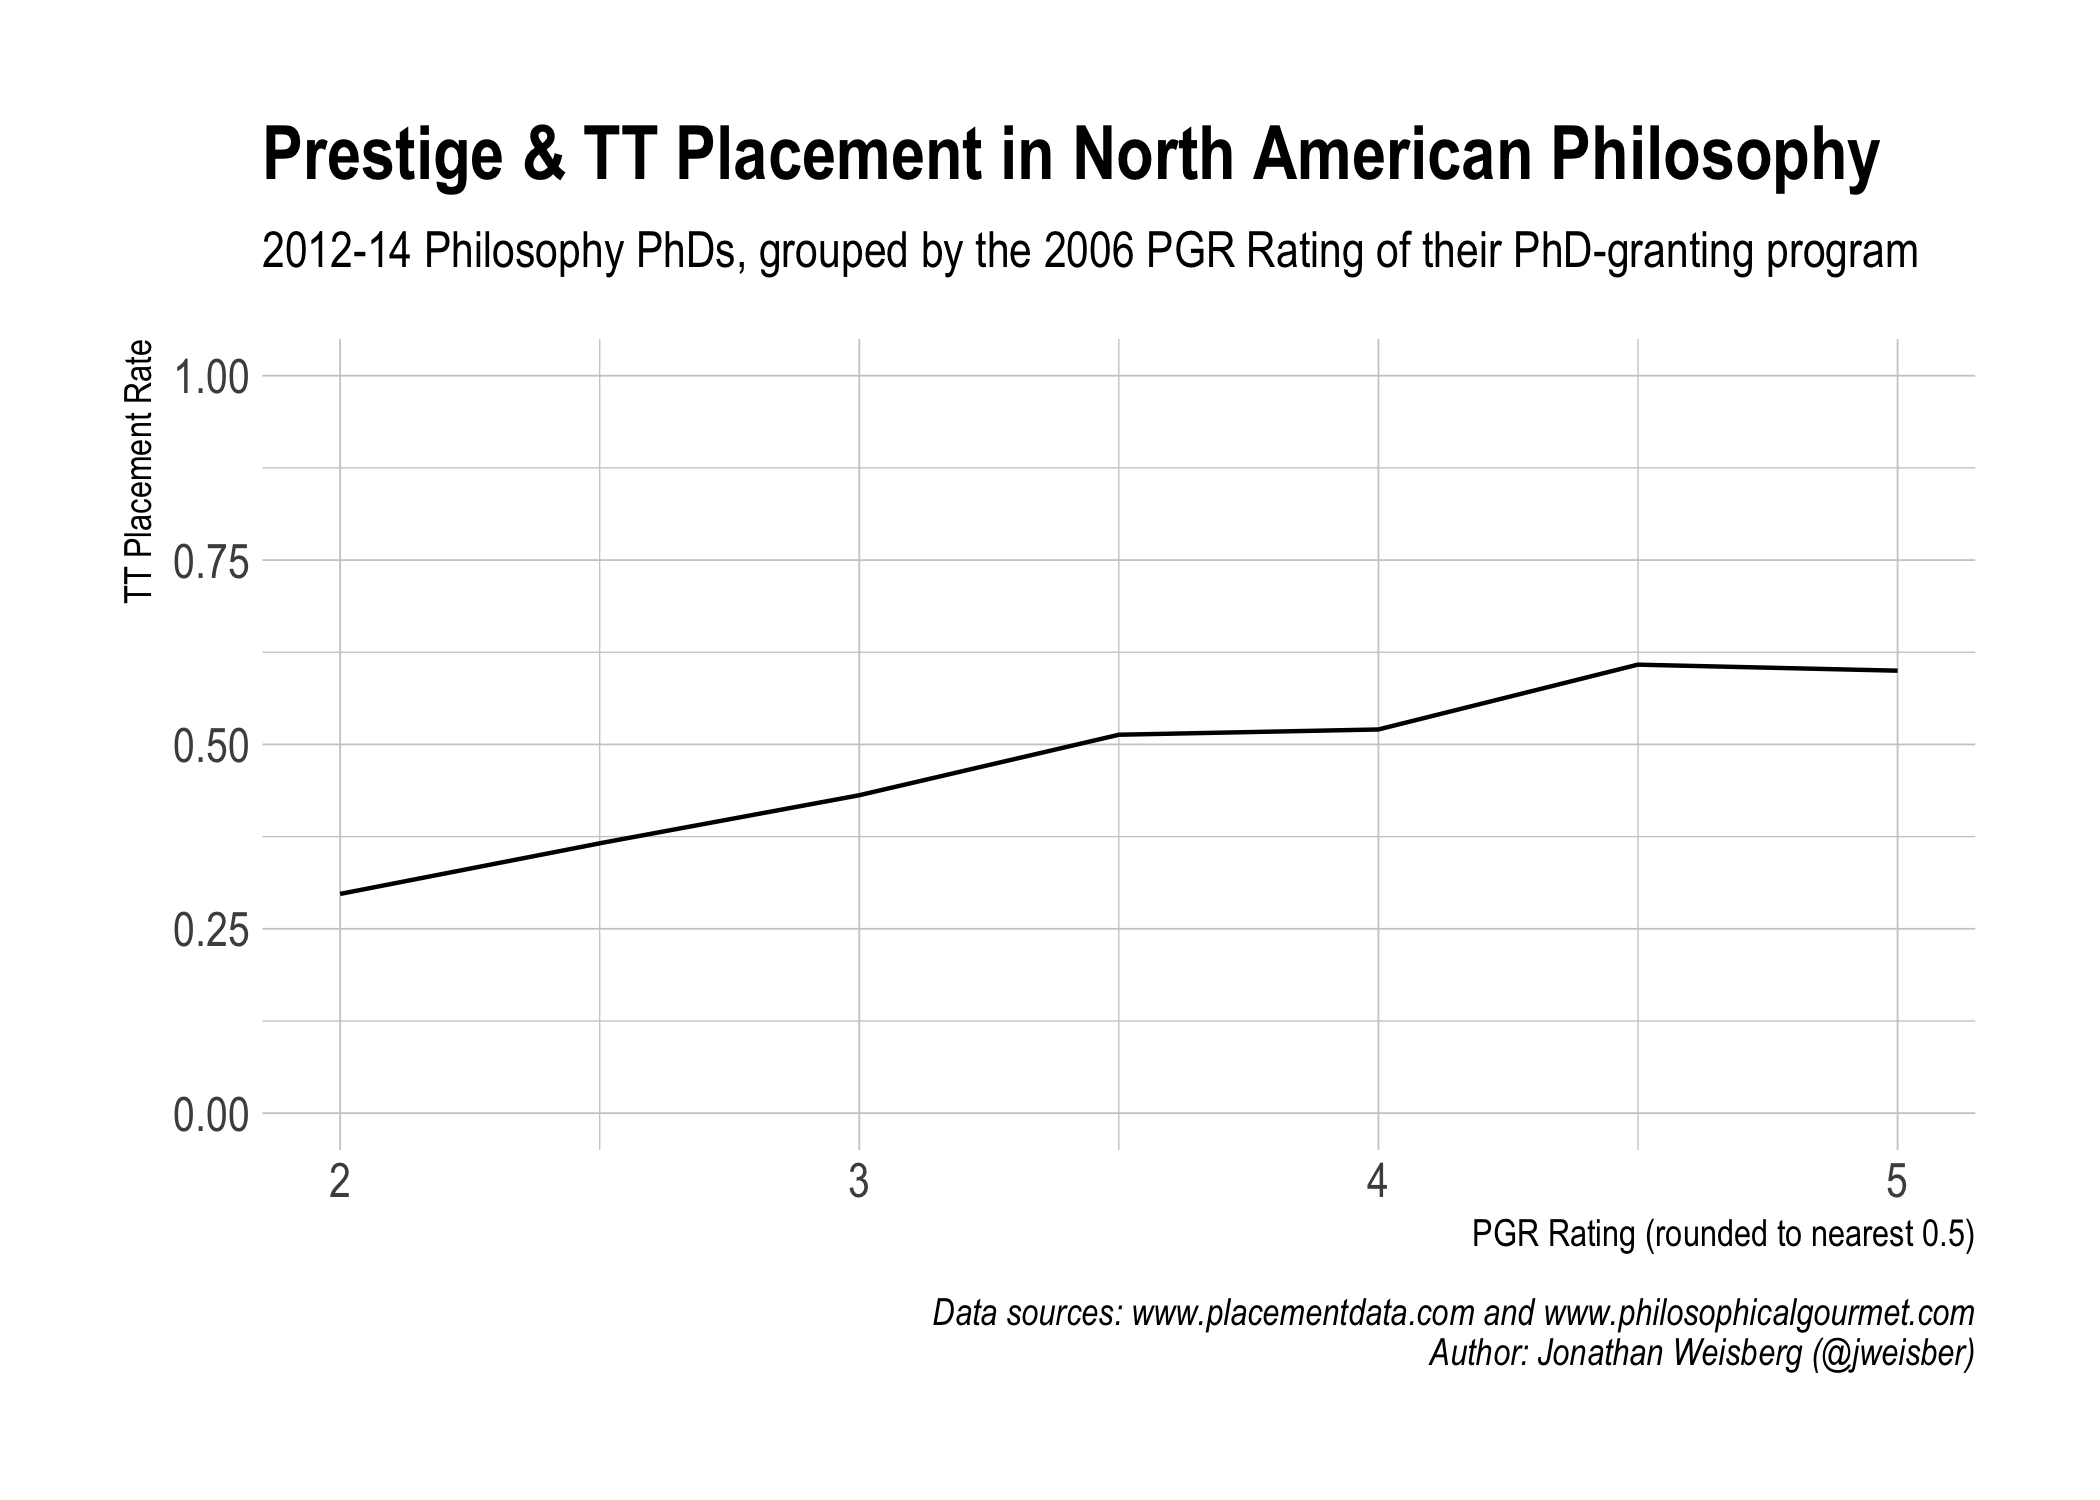
There’s clearly a positive connection; almost perfectly linear in fact. And the gist—very crudely speaking—is that a high prestige PhD about doubles your chances of landing a TT job over a low-prestige PhD: from ~30% to ~60%.
Note that the data are sparse at the extremes though. Consider this raw look, where each point is a PhD graduate.
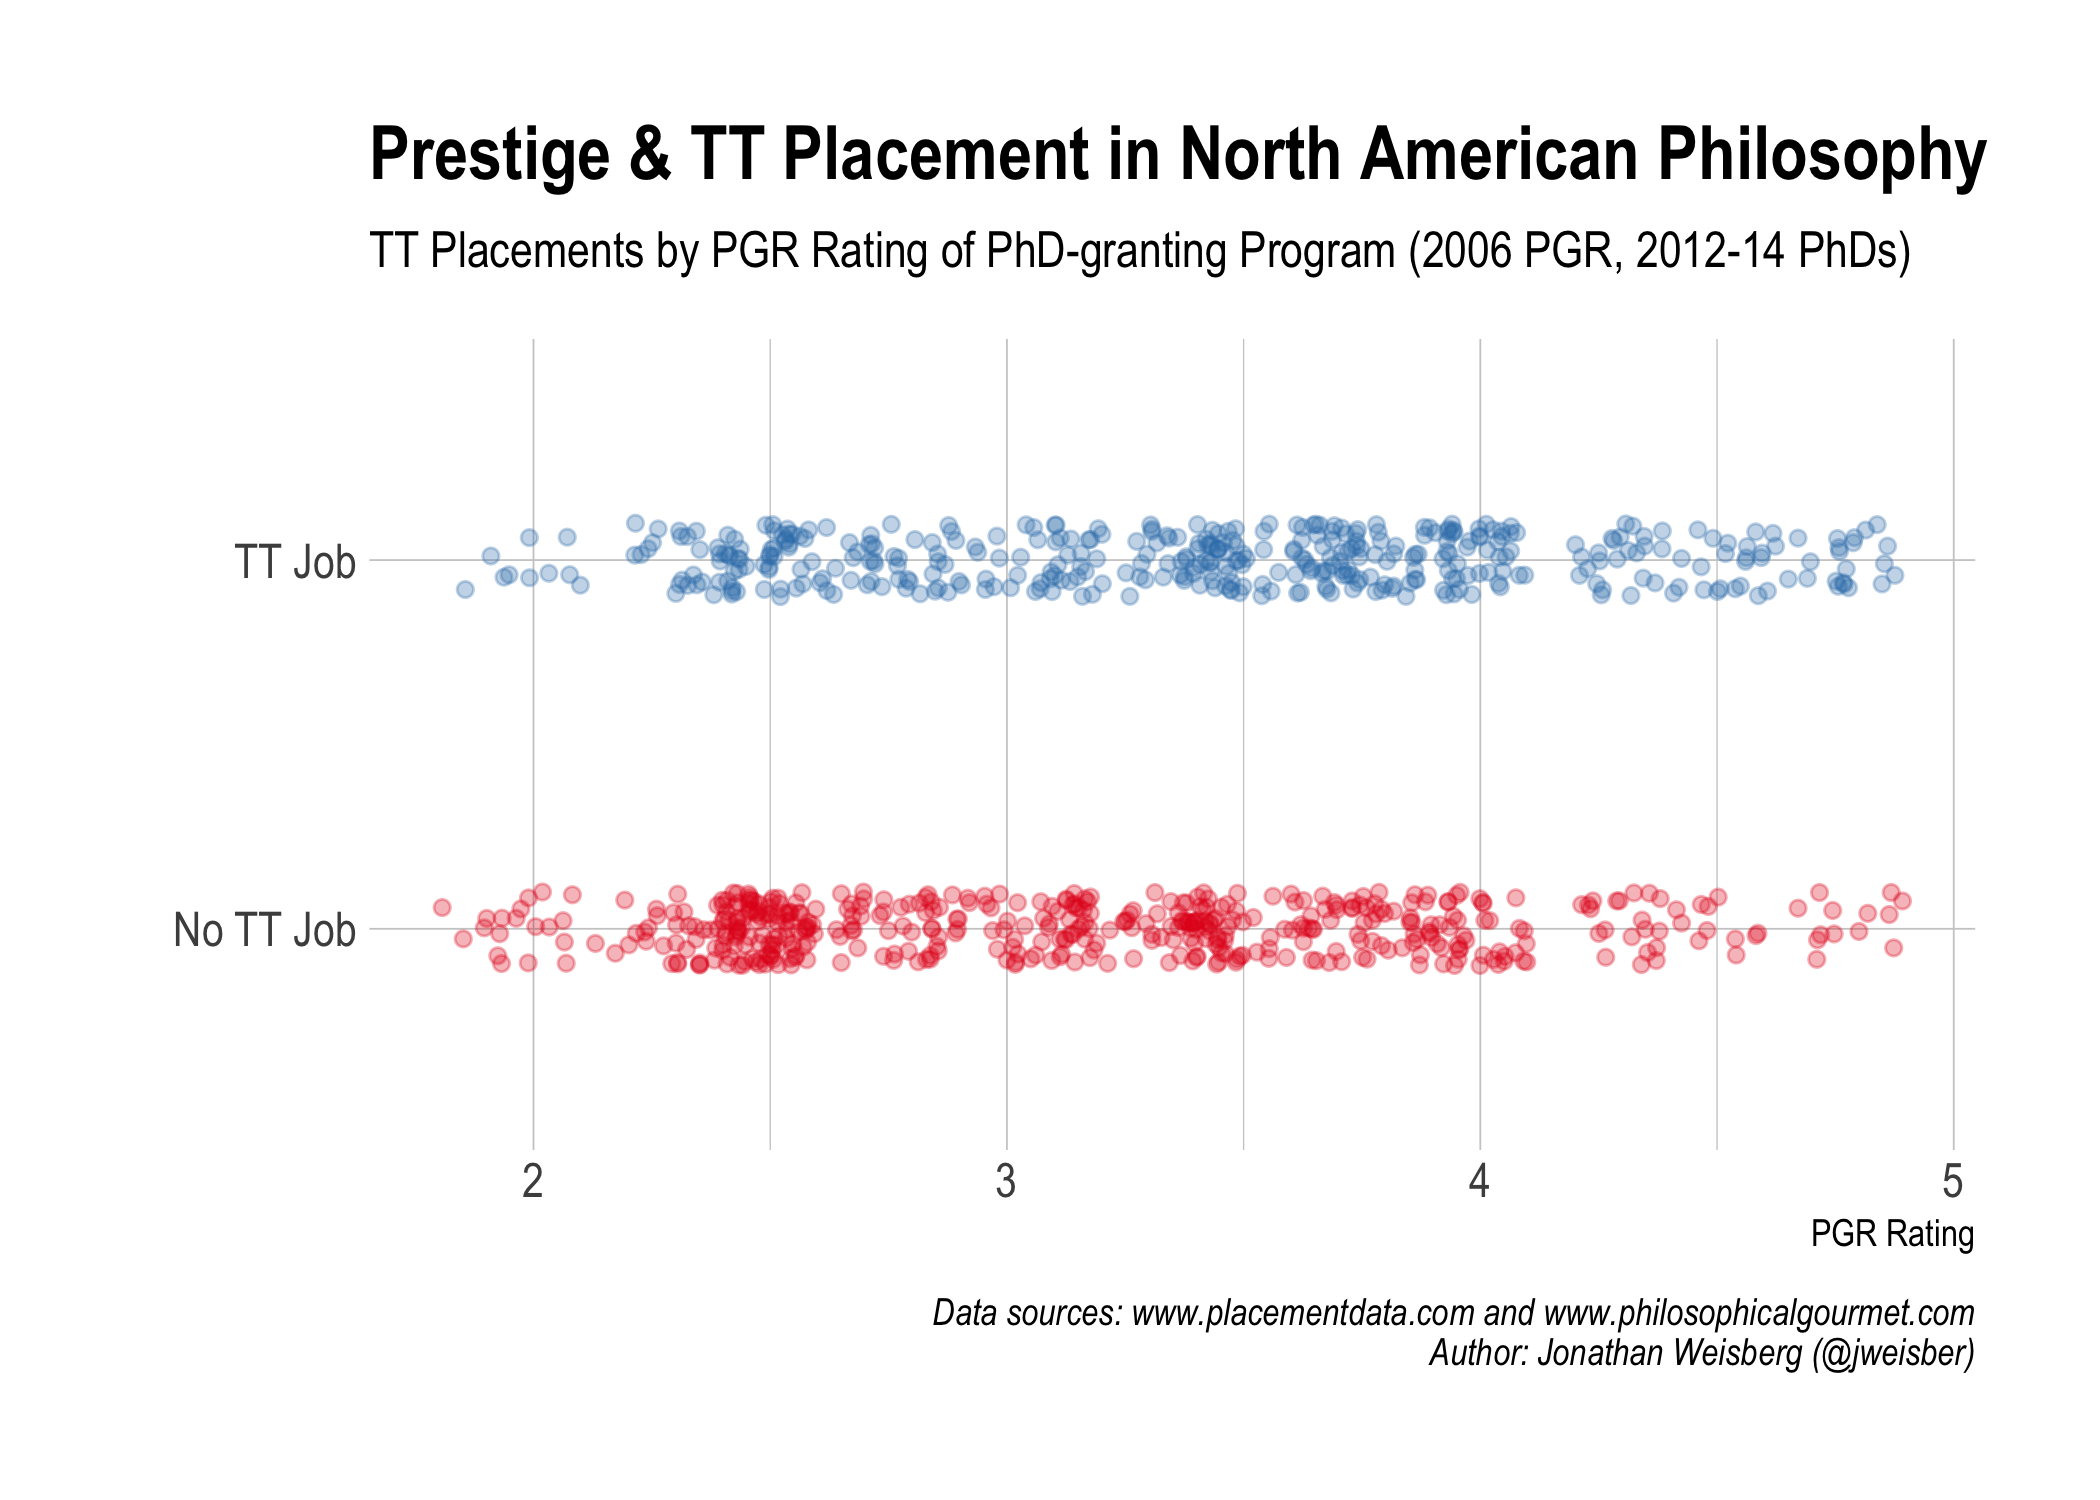
A “violin plot” shows the same thing but easier to read: the thickness of the violins indicates the density of points at each x-position.
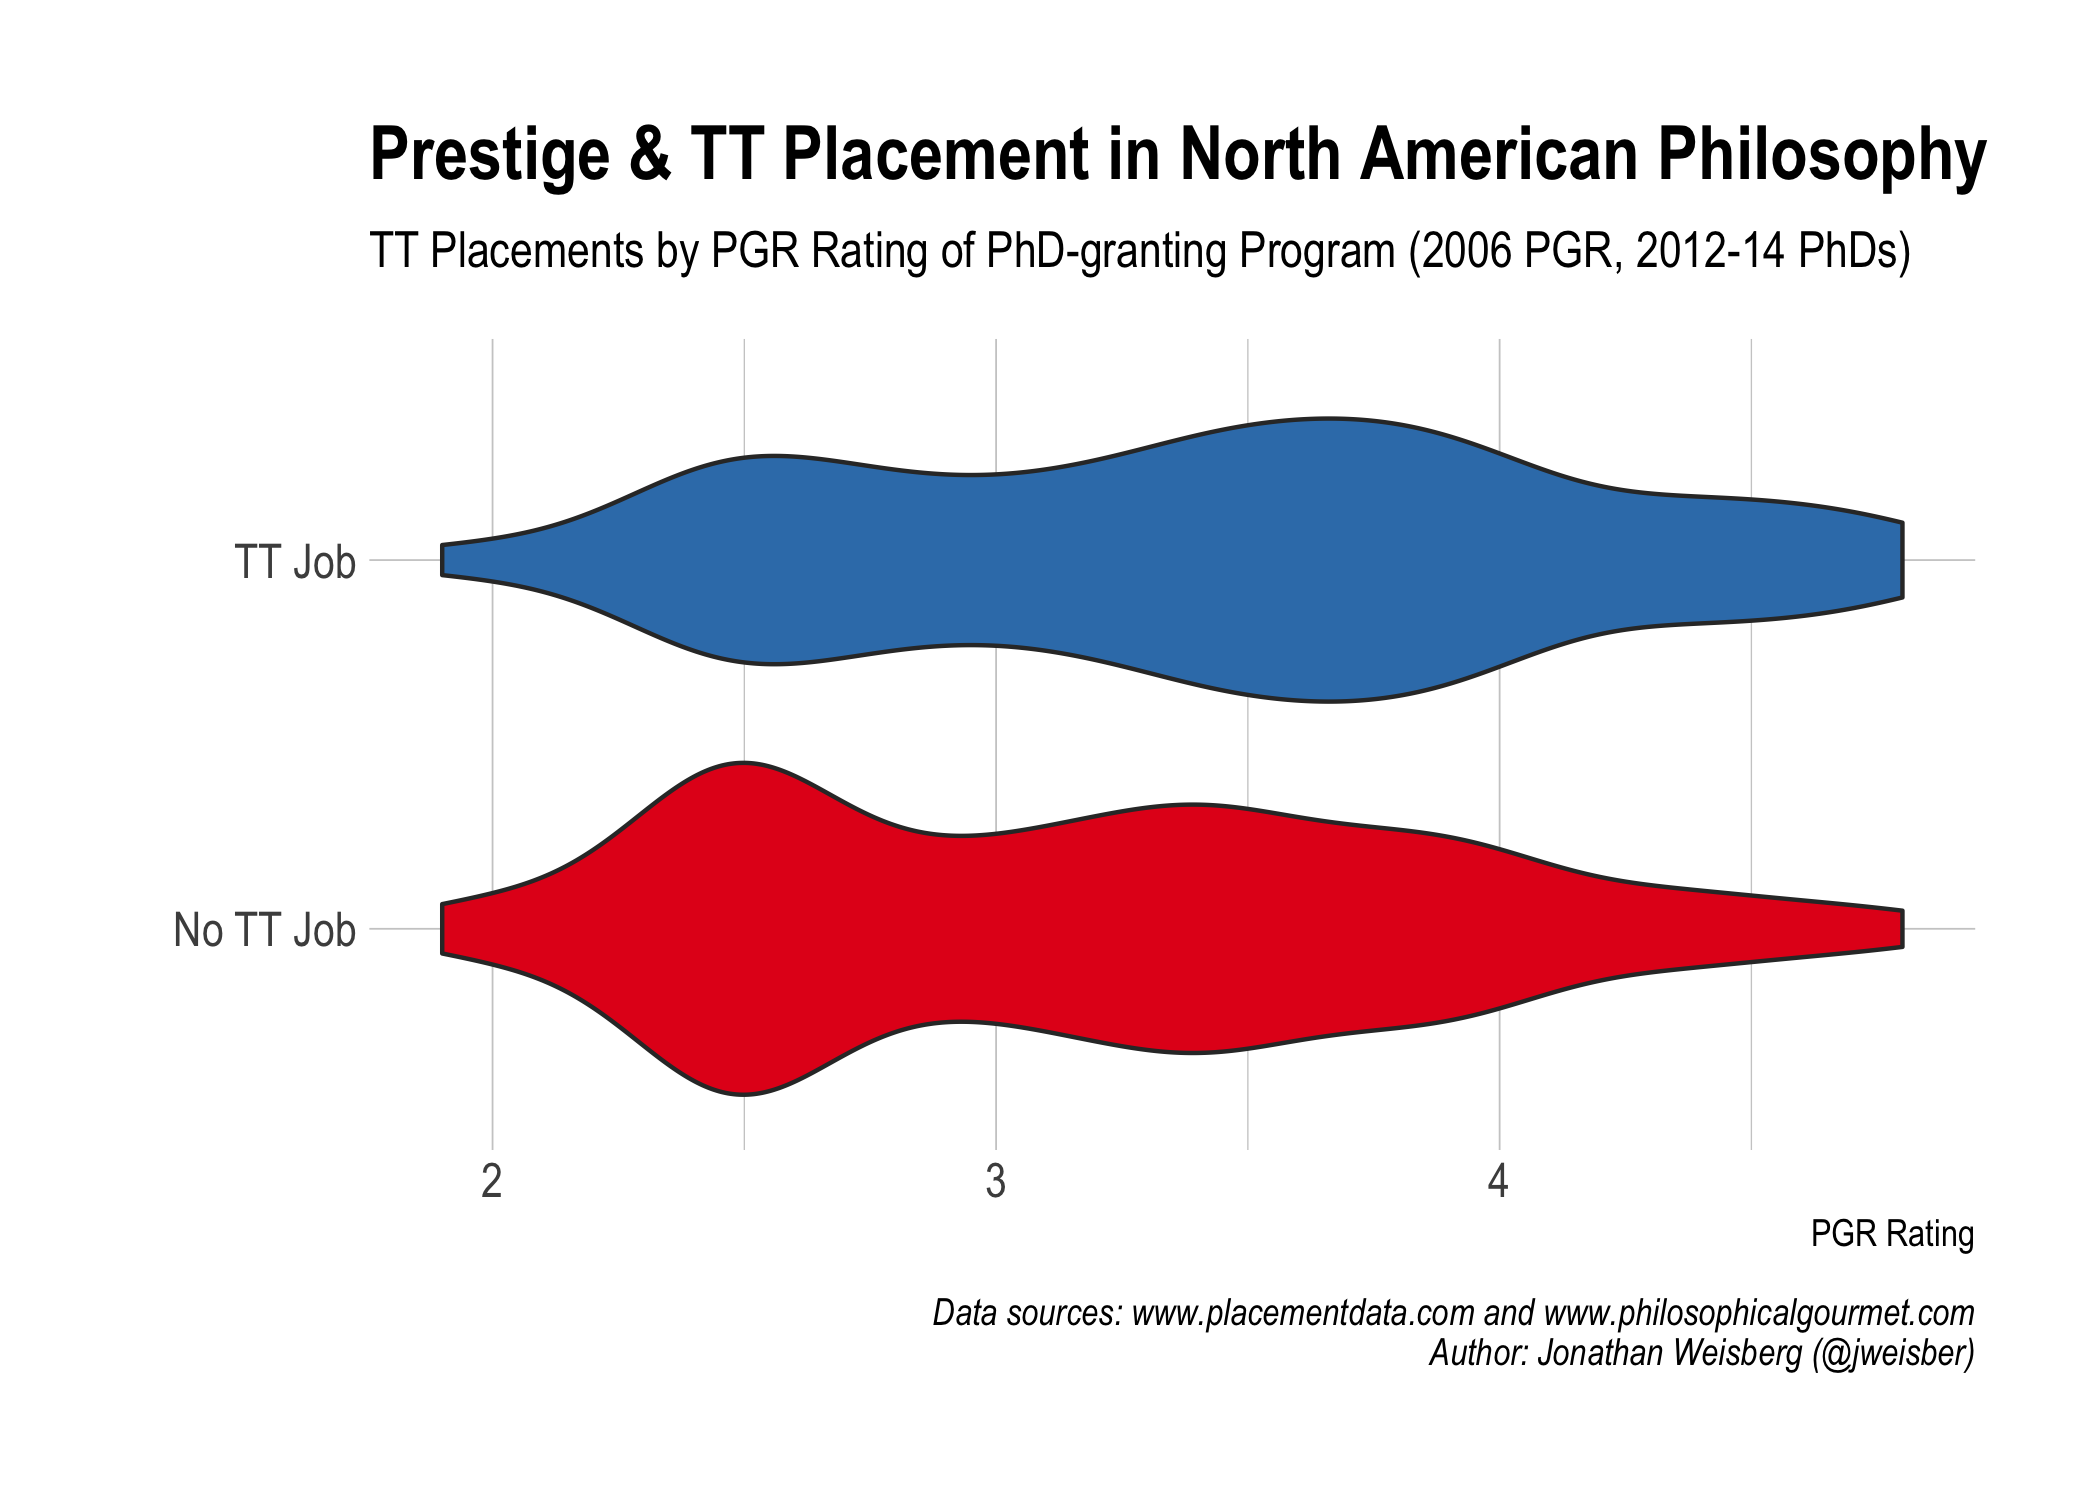
With so few points at the ends, we shouldn’t read too much into the exact placement rates there.
Other Placement Types
What about other kinds of jobs? Let’s consider five categories, defined as follows.
- Postdoc: “Fellowship/Postdoc” in the APDA database.
- Permanent: any of the following in the APDA database.
- “Tenure-Track”
- “Lecturer (Permanent)”
- “Instructor (Permanent)”
- “Adjunct (Permanent)”
- “Other (Permanent)”
- Tenure-Track: “Tenure-Track” in the APDA database.
- PhD Program: Tenure-Track at a PhD-granting program.
- PGR Ranked: Tenure-Track at a 2006 PGR-ranked program.
These are hardly perfect definitions, but they’re manageable with this data while still being pretty informative.
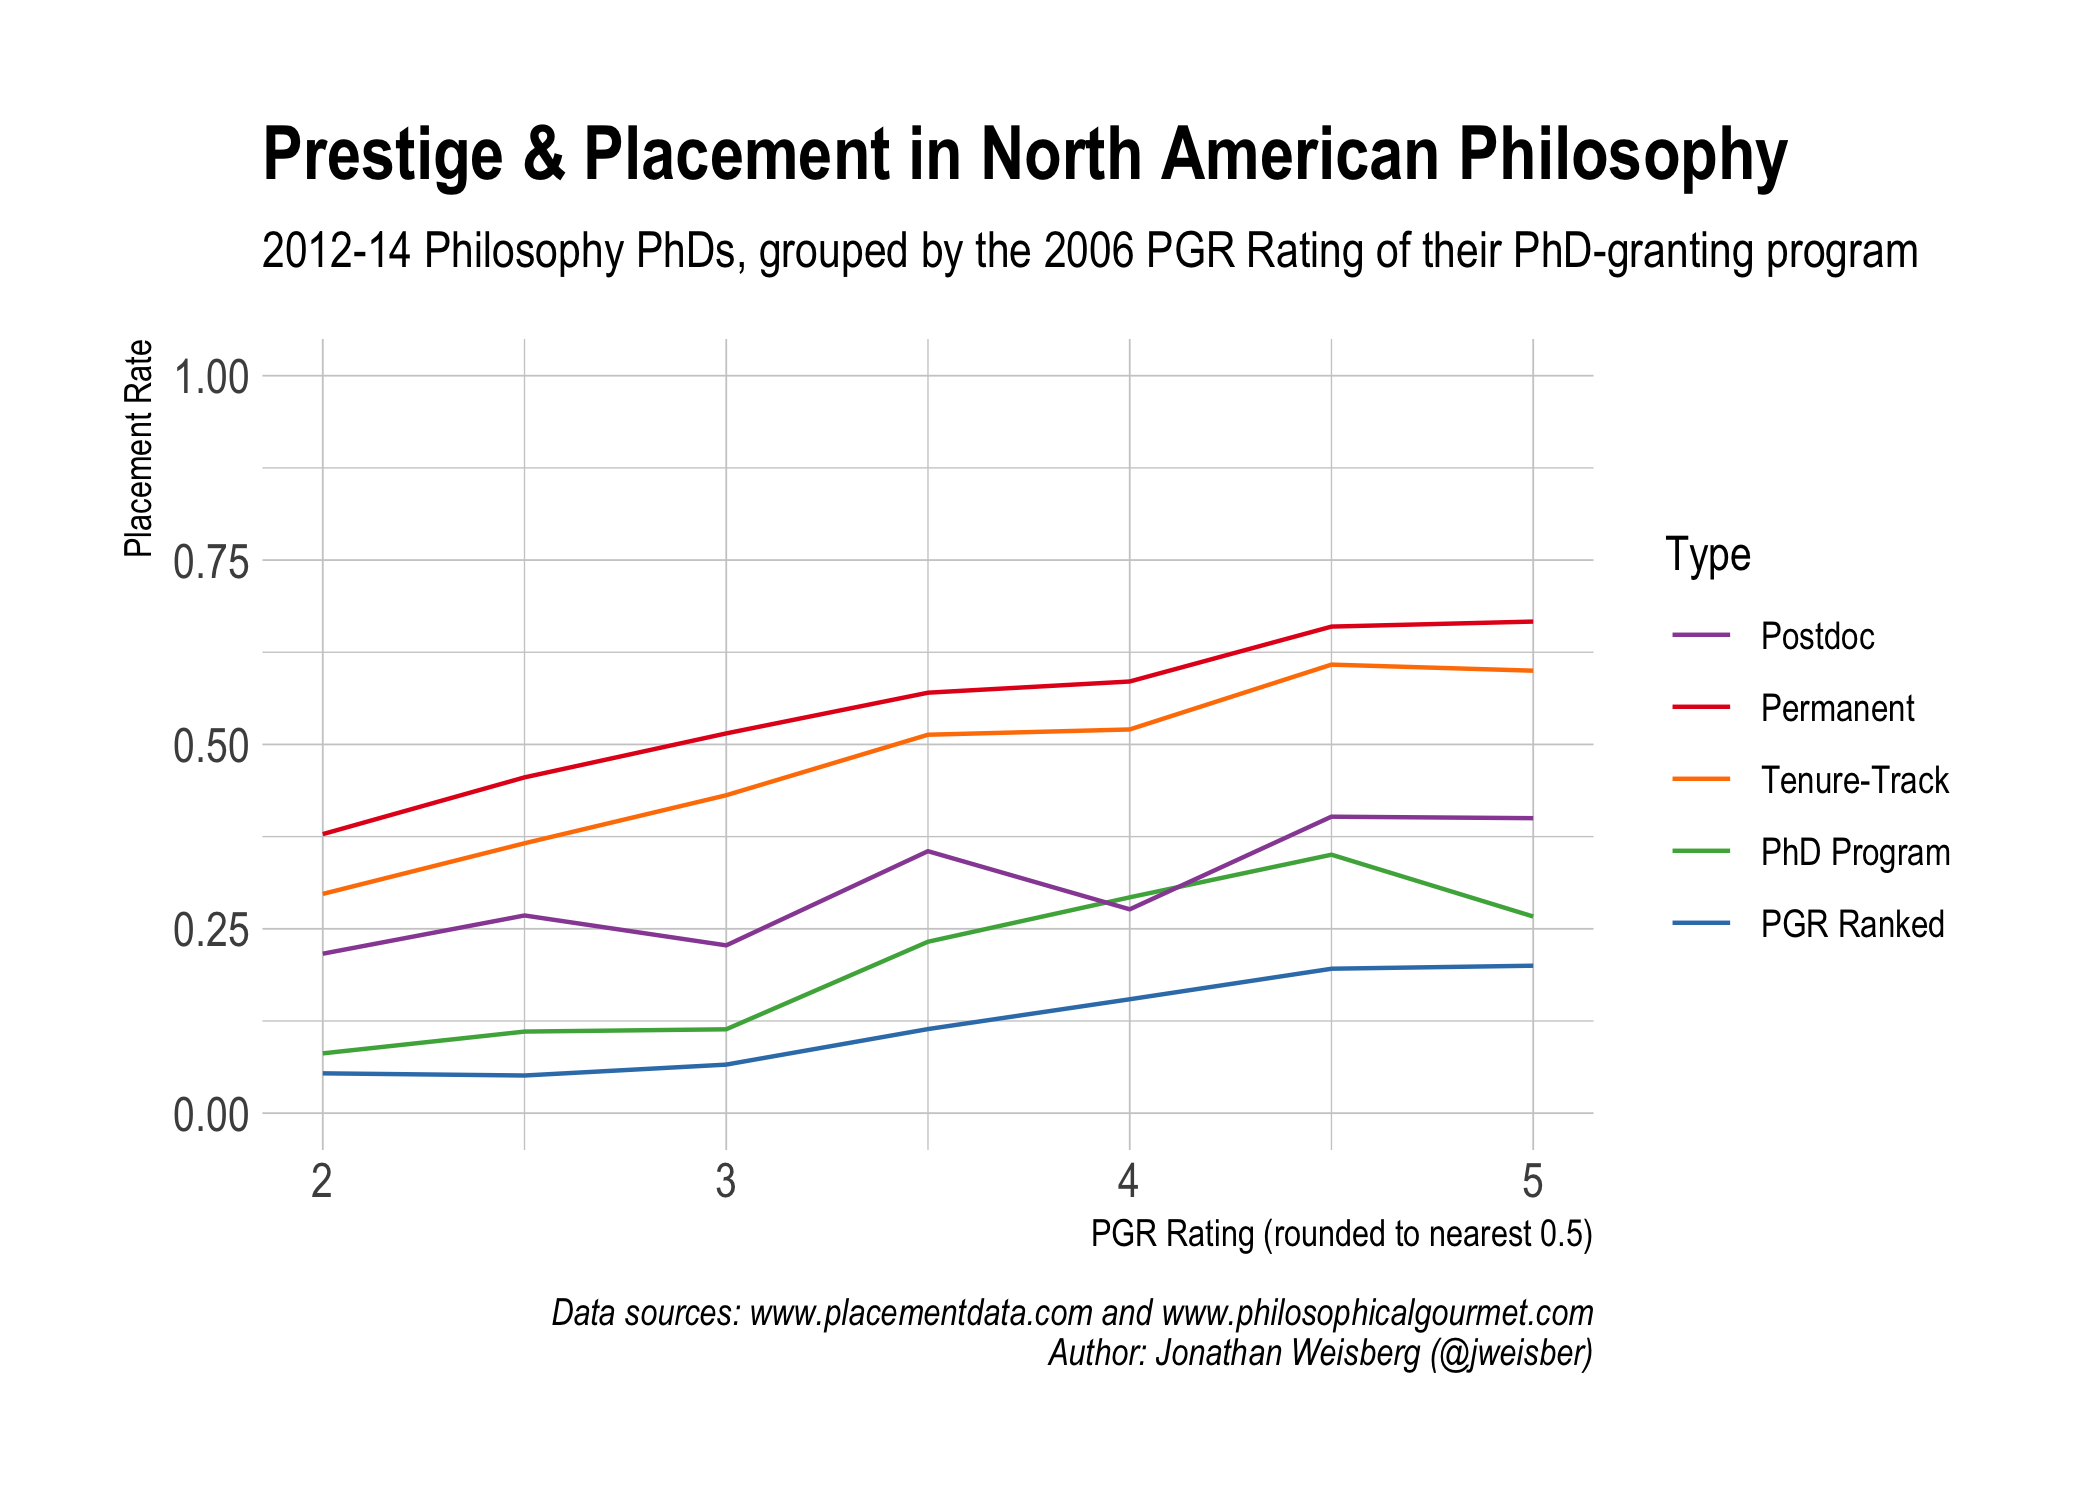
Note that a graduate can appear in multiple categories (Tenure-Track is a subset of Permanent, after all).
Unranked Programs
What about PhD programs not ranked in the 2006 PGR?4 The numbers may be iffier here. Some programs have only one graduate listed for example, a graduate who got a TT job. But there are only a few such programs, and more than 600 graduates otherwise. So the numbers may still be good approximations.
| Postdoc | Permanent | TT | PhD | PGR |
|---|---|---|---|---|
| 0.13 | 0.46 | 0.39 | 0.05 | 0.01 |
If you’re curious which programs stand out among the unranked, here are the top 10 by TT placement (excluding those with 5 or fewer graduates).
| Program | N | Postdoc | Permanent | TT | PhD | PGR |
|---|---|---|---|---|---|---|
| The Catholic University of America | 11 | 0.00 | 0.91 | 0.91 | 0.18 | 0 |
| Baylor University | 13 | 0.15 | 0.92 | 0.85 | 0.08 | 0 |
| DePaul University | 11 | 0.00 | 0.82 | 0.82 | 0.09 | 0 |
| University of Tennessee | 13 | 0.00 | 0.77 | 0.77 | 0.00 | 0 |
| University of New Mexico | 7 | 0.00 | 0.71 | 0.71 | 0.00 | 0 |
| Vanderbilt University | 9 | 0.11 | 0.67 | 0.67 | 0.00 | 0 |
| University of South Florida | 15 | 0.13 | 0.60 | 0.60 | 0.00 | 0 |
| Florida State University | 12 | 0.17 | 0.58 | 0.58 | 0.08 | 0 |
| University of Oregon | 12 | 0.17 | 0.67 | 0.58 | 0.00 | 0 |
| University of Kansas | 9 | 0.00 | 0.67 | 0.56 | 0.00 | 0 |
Note that the top 3 are at Christian universities, and as you might expect, a lot of their placement is driven by hires at Christian schools.
Here are the 10 “largest” programs, i.e. those with the most graduates listed in the APDA database.
| Program | N | Postdoc | Permanent | TT | PhD | PGR |
|---|---|---|---|---|---|---|
| Boston College | 28 | 0.21 | 0.68 | 0.50 | 0.04 | 0.00 |
| The New School | 26 | 0.23 | 0.31 | 0.27 | 0.08 | 0.00 |
| Purdue University | 22 | 0.14 | 0.32 | 0.27 | 0.00 | 0.00 |
| Stony Brook University | 22 | 0.00 | 0.55 | 0.41 | 0.05 | 0.00 |
| Emory University | 21 | 0.52 | 0.62 | 0.52 | 0.10 | 0.05 |
| Southern Illinois University | 20 | 0.05 | 0.30 | 0.30 | 0.00 | 0.00 |
| Duquesne University | 18 | 0.22 | 0.50 | 0.44 | 0.00 | 0.00 |
| Fordham University | 18 | 0.22 | 0.44 | 0.39 | 0.00 | 0.00 |
| Villanova University | 18 | 0.00 | 0.78 | 0.39 | 0.00 | 0.00 |
| University of Guelph | 17 | 0.12 | 0.06 | 0.00 | 0.00 | 0.00 |
Departmental TT Placement
Looking at placement rates by department raises the question: how well does a department’s PGR rating predict its TT placement rate?
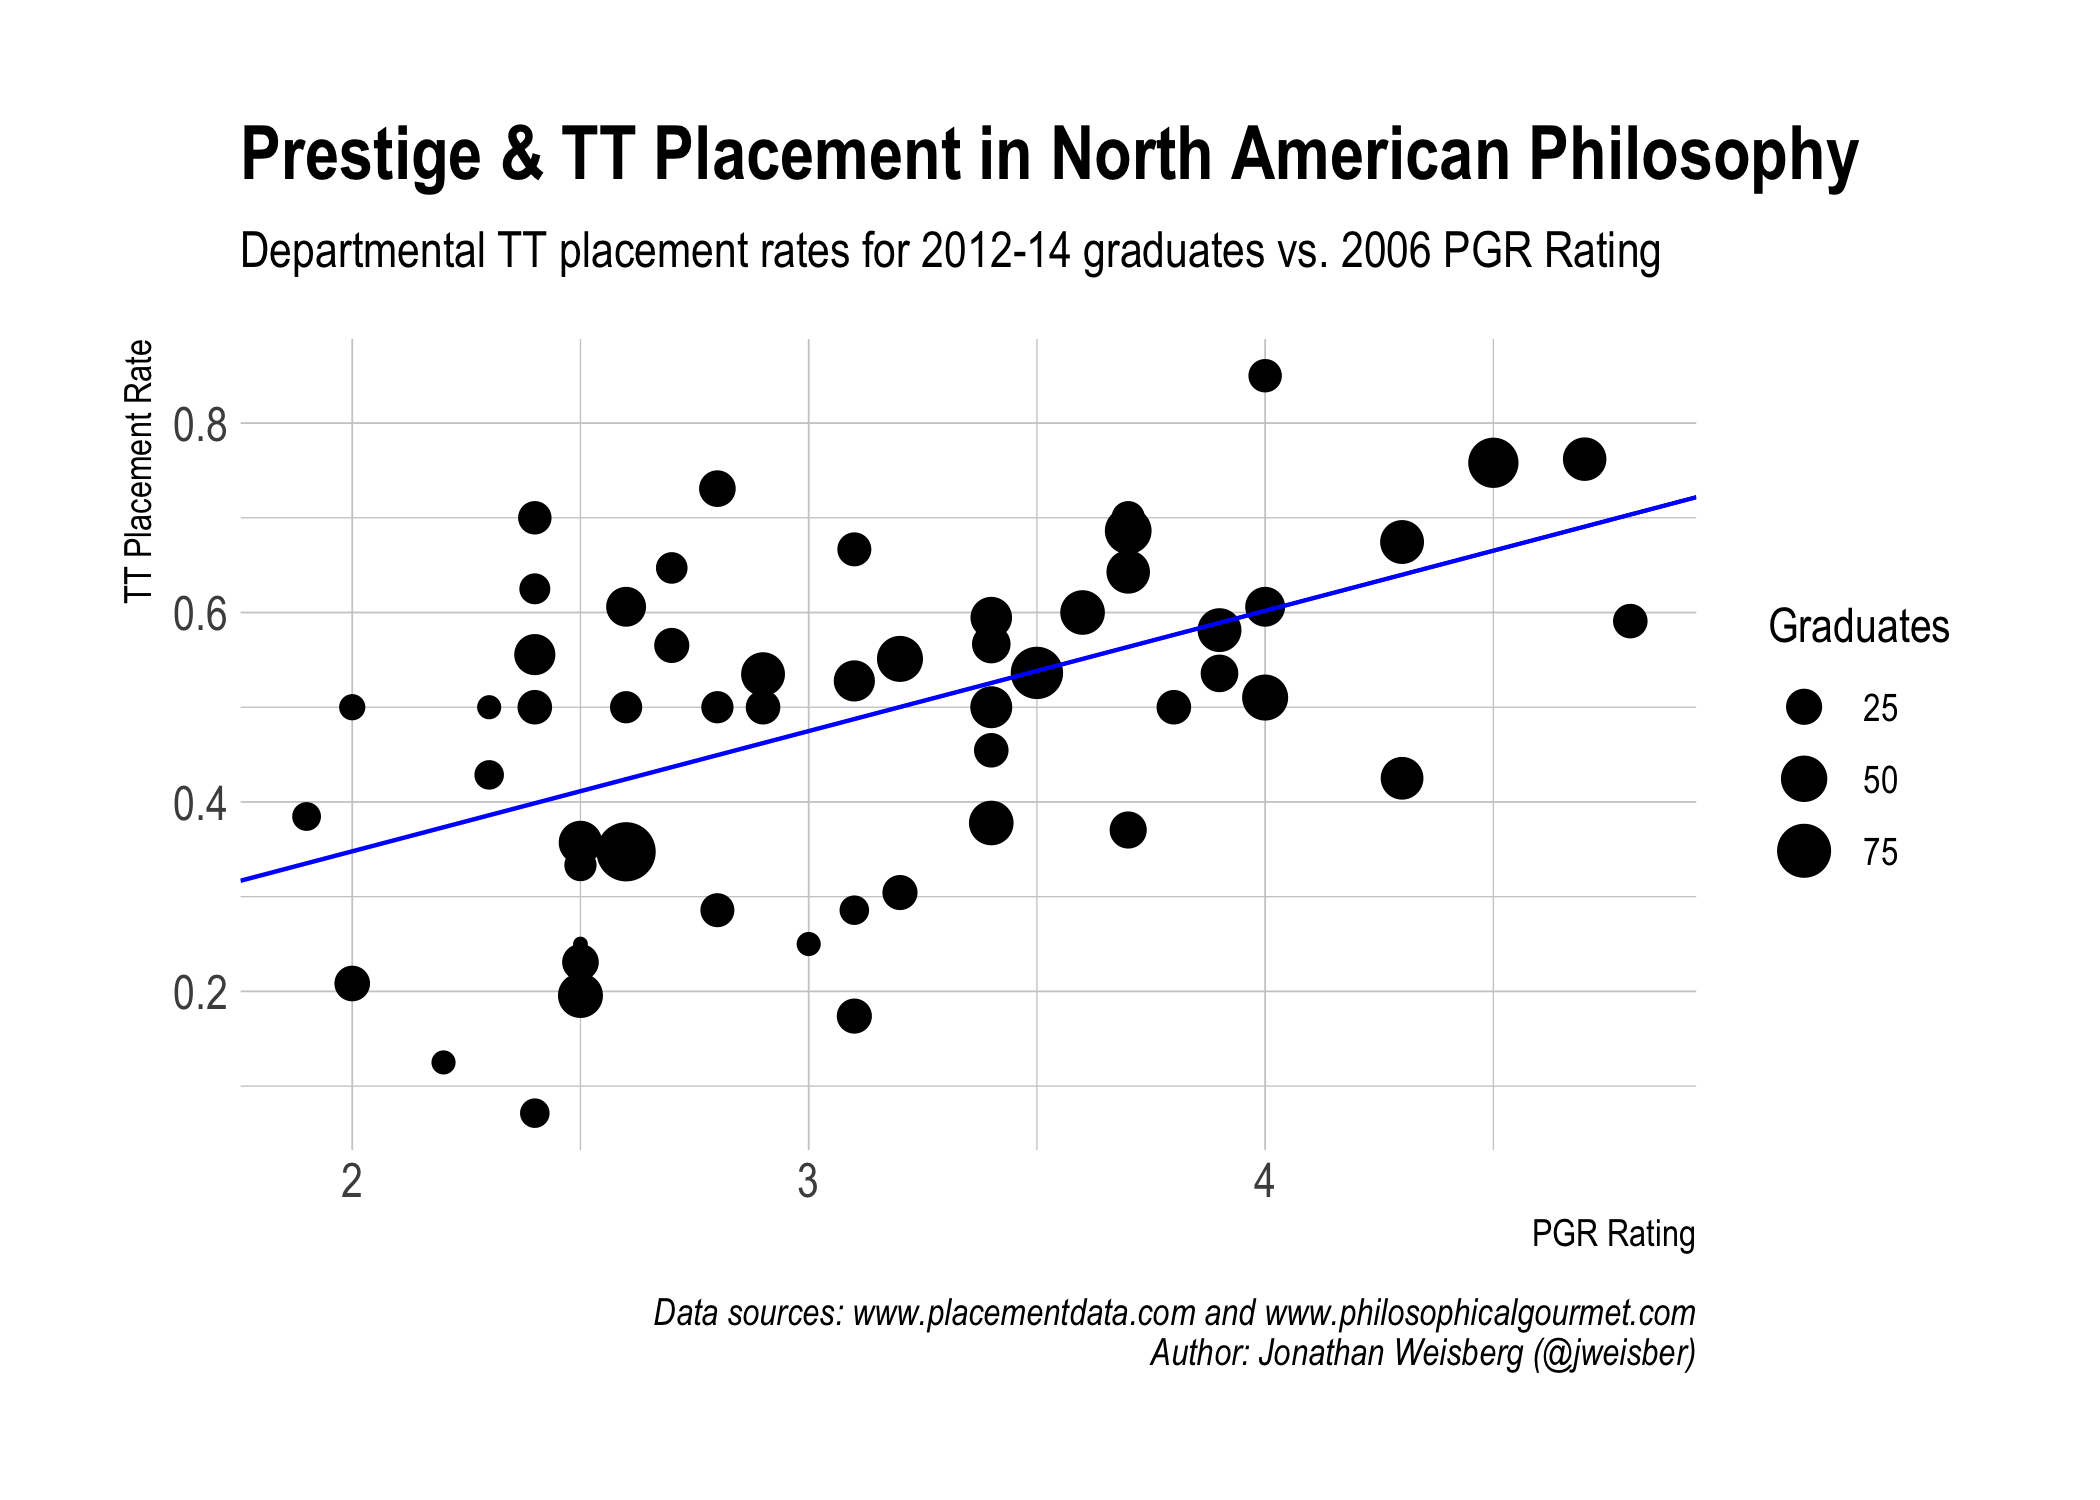
There’s a clear connection, but also a lot of variation. Which are the programs that especially stand out from the trend? Suppressing the sizing for visibility, we can label those programs above/below the trendline by at least 0.2.
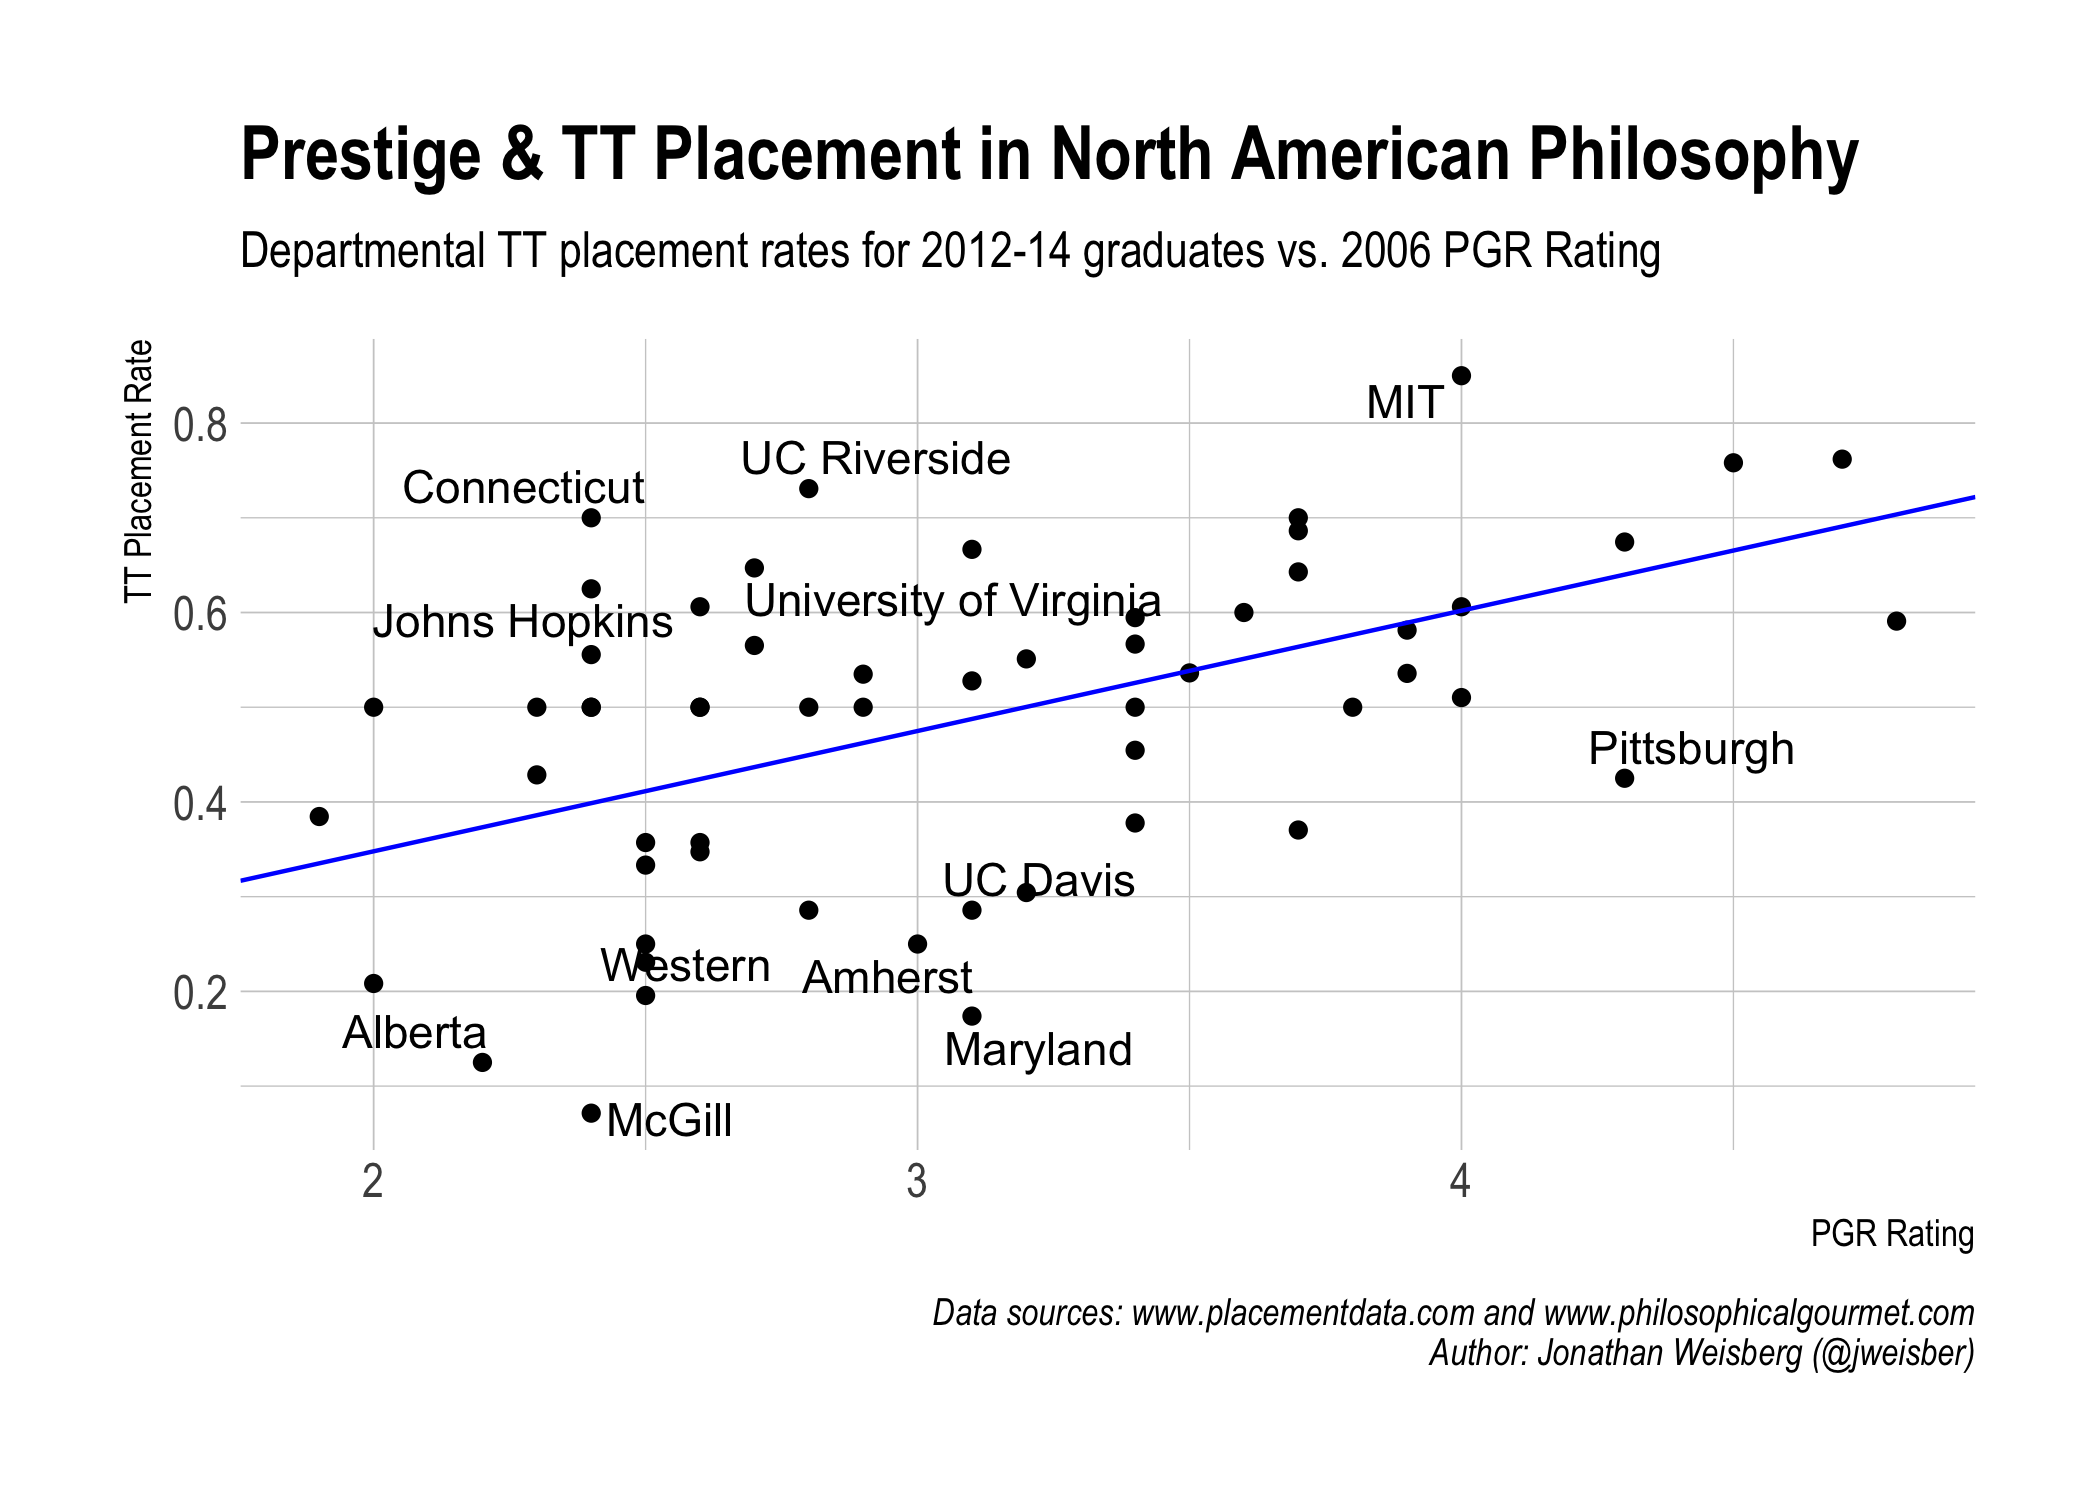
For complete listings of departmental placement rates, check out the APDA’s infograms here.
The code for this analysis is available here.
Also check out Figure 1 in this paper by Helen De Cruz.
[return]Why these years? Because that’s where the data is best. The APDA has focused its collection efforts so far on graduates from the years 2012–16, so that’s where the data is the most plentiful. But the data for 2015 and 2016 graduates probably aren’t “ripe” enough yet for our purposes; many graduates who will ultimately find TT jobs are probably still in postdocs and other temporary gigs. Thanks to Brian Weatherson for pushing me to take this into account.
Of course, the 2012–2014 data aren’t fully ripe either. But previous noodling suggests they’re probably pretty close.
[return]Why the 2006 edition? Partly for continuity with the APDA’s own analysis. But also because students often use PGR rankings to choose PhD programs, and the rankings available to them typically predate the year of their PhD by 6 or 7 years.
[return]Thanks to Amanda at the Philosophers’ Cocoon for prompting me to look at this.
[return]