We looked at author gender in a previous post, today let’s consider referees. Does their gender have any predictive value?
Once again our discussion only covers men and women because we don’t have the data to support a deeper analysis.1
Using data from Ergo, we’ll consider the following questions:
- Requests. How are requests to referee distributed between men and women? Are men more likely to be invited, for example?
- Responses. Does gender inform a referee’s response to a request? Are women more likely to say ‘yes’, for example?
- Response-speed. Does gender inform how quickly a referee responds to an invitation (whether to agree or to decline)? Do men take longer to agree/decline an invitation, for example?
- Completion-speed. If a referee does agree to provide a report, does their gender inform how quickly they’ll complete that report? Do men and women tend to complete their reports in the same time-frame?
- Recommendations. Does gender inform how positive/negative a referee’s recommendation is? Are men and women equally likely to recommend that a submission be rejected, for example?
- Influence. Does a referee’s gender affect the influence of their recommendation on the editor’s decison? Are the recommendations of male referees more likely to be followed, for example?
A quick overview of our data set: there are a total of 1526 referee-requests in Ergo’s database. But only 1394 are included in this analysis. I’ve excluded:
- Requests to review an invited resubmission, since these are a different sort of beast.
- Pending requests and reports, since the data for these are incomplete.
- A handfull of cases where the referee’s gender is either unknown, or doesn’t fit the male/female classification.
Requests
How are requests distributed between men and women? 322 of our 1394 requests went to women, or 23.1% (1072 went to men, or 76.9%).
How does this compare to the way men and women are represented in academic philosophy in general? Different sources and different subpopulations yield a range of estimates.
At the low end, we saw in an earlier post that about 15.3% of Ergo’s submissions come from women. The PhilPapers survey yields a range from 16.2% (all respondents) to 18.4% (“target” faculty). And sources cited in Schwitzgebel & Jennings estimate the percentage of women faculty in various English speaking countries at 23% for Australia, 24% for the U.K., and 19–26% for the U.S.
So we have a range of baseline estimates from 15% to 26%. For comparison, the 95% confidence interval around our 23.1% finding is (21%, 25.4%).
Responses
Do men and women differ in their responses to these requests? Here are the raw numbers:
| Agreed | Declined / No Response / Canceled | |
|---|---|---|
| Female | 101 | 221 |
| Male | 403 | 669 |
The final column calls for some explanation. I’m lumping togther several scenarios here: (i) the referee responds to decline the request, (ii) the referee never responds, (iii) the editors cancel the request because it was made in error. Unfortunately, these three scenarios are hard to distinguish based on the raw data. For example, sometimes a referee declines by email rather than via our online system, and the handling editor then cancels the request instead of marking it as “Declined”.
With that in mind, here are the proportions graphically:
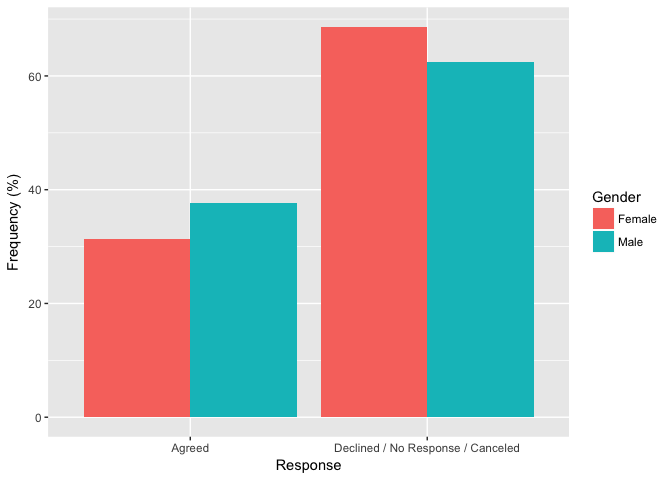
Men agreed more often than women: approximately 38% vs. 31%. And this difference is statistically significant.2
Note that women and men accounted for about 20% and 80% of the “Agreed” responses, respectively. Whether this figure differs significantly from the gender makeup of “the general population” depends, as before, on the source and subpopulation we use for that estimate.
We saw that estimates of female representation ranged from roughly 15% to 26%. For comparison, the 95% confidence interval around our 20% finding is (16.8%, 23.8%).
Response-speed
Do men and women differ in response-speed—in how quickly they respond to a referee request (whether to agree or to decline)?
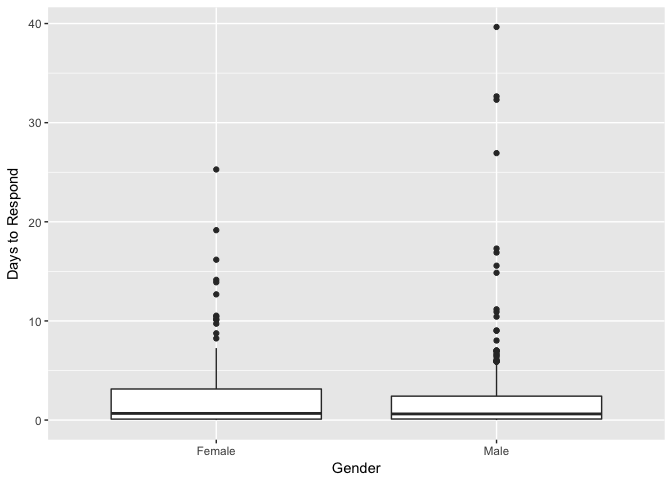
The average response-time for women is 1.92 days, and for men it’s 1.58 days. This difference is not statistically significant.3
A boxplot likewise suggests that men and women have similar interquartile ranges:
Completion-speed
What about completion-speed: is there any difference in how long men and women take to complete their reports?
Women took 27.6 days on average, while men took 23.8 days. This difference is statistically significant.4
Does that mean men are more likely to complete their reports on time? Not necessarily. Here’s a frequency polygram showing when reports were completed:
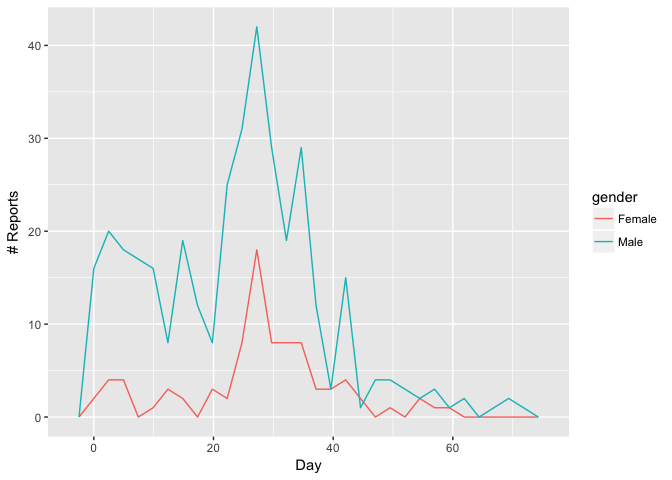
The spike at the four-week mark corresponds to the standard due date. We ask referees to submit their reports within 28 days of the initial request.
It looks like men had a stronger tendency to complete their reports early. But were they more likely to complete them on time?
One way to tackle this question is to look at how completed reports accumulate with time (the empirical cumulative distribution):
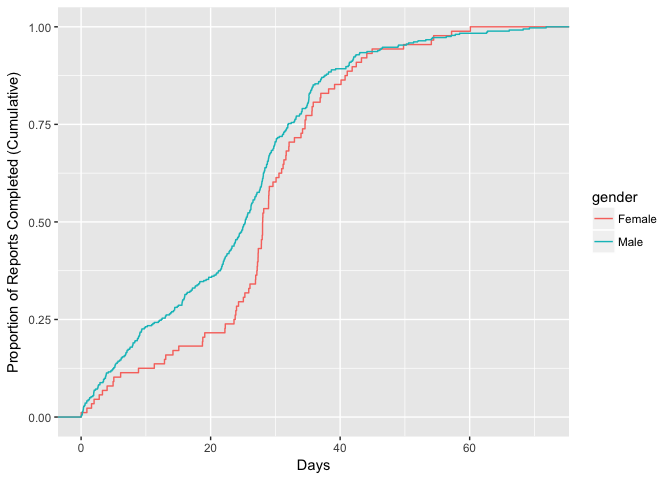
As expected, the plot shows that men completed their reports early with greater frequency. But it also looks like women and men converged around the four-week mark, when reports were due.
Another way of approaching the question is to classify reports as either “On Time” or “Late”, according to whether they were completed before Day 29.
| On Time | Late | |
|---|---|---|
| Female | 50 | 38 |
| Male | 242 | 121 |
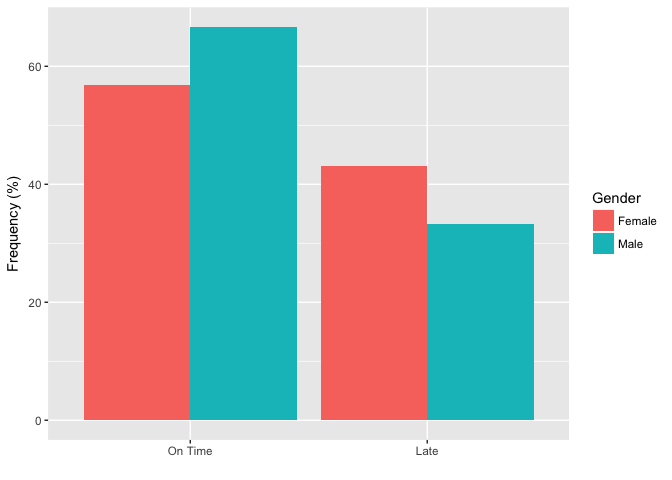
A chi-square test of independence then finds no statistically significant difference.5
Apparently men and women differed in their tendency to be early, but not necessarily in their tendency to be on time.
Recommendations
Did male and female referees differ in their recommendations to the editors?
Ergo offers referees four recommendations to choose from. The raw numbers:
| Reject | Major Revisions | Minor Revisions | Accept | |
|---|---|---|---|---|
| Female | 42 | 29 | 9 | 8 |
| Male | 154 | 103 | 61 | 45 |
In terms of frequencies:
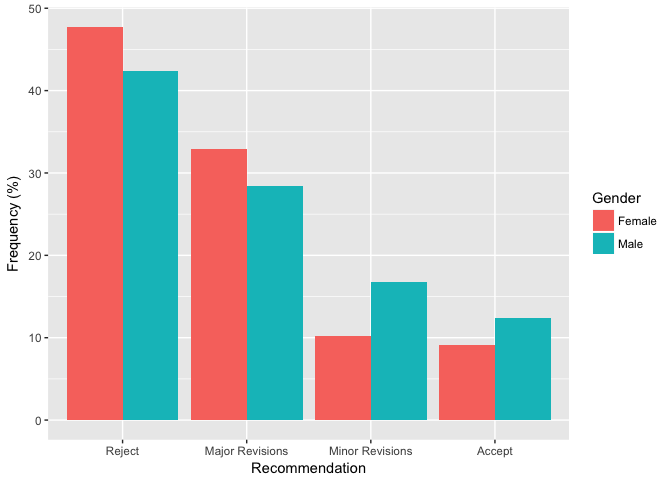
The differences here are not statistically significant according to a chi-square test of independence.6
Influence
Does a referee’s gender affect whether the editor follows their recommendation? We can tackle this question a few different ways.
One way is to just tally up those cases where the editor’s decision was the same as the referee’s recommendation, and those where it was different.
| Same | Different | |
|---|---|---|
| Female | 51 | 37 |
| Male | 206 | 157 |
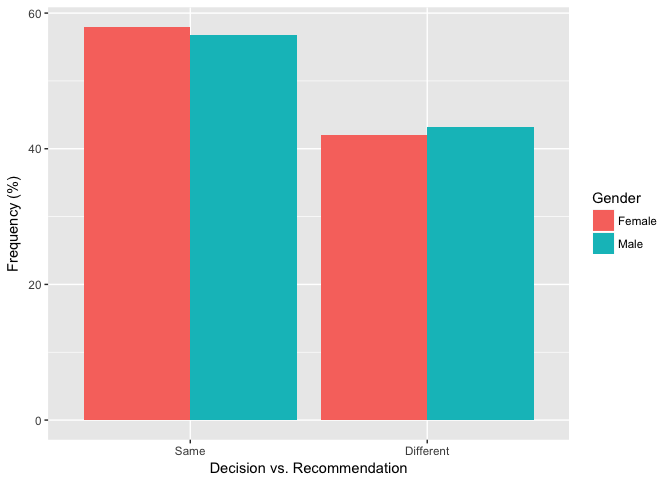
Clearly there’s no statistically significant difference between male and female referees here.7
A second approach would be to assign numerical ranks to referees’ recommendations and editors’ decisions: Reject = 1, Major Revisions = 2, etc. Then we can consider how far the editor’s decision is from the referee’s recommendation. For example, a decision of Accept is 3 away from a recommendation of Reject, while a decision of Major Revisions is 2 away from a recommendation of Accept.
By this measure, the average distance between the referee’s recommendation and the editor’s decision was 0.57 for women and 0.56 for men—clearly not a statistically significant difference.8
Summary
Men received more requests to referee than women, as expected given the well known gender imbalance in academic philosophy. The distribution of requests between men (76.9%) and women (23.1%) was in line with some estimates of the gender makeup of academic philosophy, though not all estimates.
Men were more likely to agree to a request (38% vs. 31%), a statistically significant difference. Women accounted for about 20% of the “Agreed” responses, however, consistent with most (but not all) estimates of the gender makeup of academic philosophy.
There was no statistically significant difference in response-speed, but there was in the speed with which reports were completed (23.8 days on average for men, 27.6 days for women). This difference appears to be due to a stronger tendency on the part of men to complete their reports early, though not necessarily a greater chance of meeting the deadline.
Finally, there was no statistically significant difference in the recommendations of male and female referees, or in editors’ uptake of those recommendations.
Technical Notes
This post was written in R Markdown and the source is available on GitHub. I’m new to both R and classical statistics, and this post is a learning exercise for me. So I encourage you to check the code and contact me with corrections.
- Unlike in the previous analysis of author gender, however, here we do have a few known cases where either (i) the referee identifies as neither male nor female, or (ii) they identify as something more specific, e.g. “transgender male” rather than just “male”. But these cases are still too few for statistical analysis. [return]
- $\chi^2$(1, N = 1394) = 3.89, p = 0.05. [return]
- t(437.43) = -1.63, p = 0.1 [return]
- t(144.26) = -2.46, p = 0.02 [return]
- $\chi^2$(1, N = 451) = 2.59, p = 0.11. [return]
- $\chi^2$(3, N = 451) = 3.6, p = 0.31. [return]
- $\chi^2$(1, N = 451) = 0.01, p = 0.93. [return]
- t(117.57) = 0.07, p = 0.95. [return]