Update: editors at CJP and Phil Quarterly have kindly shared some important, additional information. See the edit below for details.
A new paper on the representation of women in philosophy journals prompted some debate in the philosophy blogosphere last week. The paper found women to be underrepresented across a range of prominent journals, yet overrepresented in the two journals studied where review was non-anonymous.
Commenters over at Daily Nous complained about the lack of base-rate data. How many of the submissions to these journals were from women? In some respects, it’s hard to know what to make of these findings without such data.
A few commenters linked to a survey conducted by the APA and BPA a while back, which supplies some numbers along these lines. I was surprised, because I’ve wondered about these numbers, but I didn’t recall seeing this data-set before. I was excited too because the data-set is huge, in a way: it covers more than 30,000 submissions at 40+ journals over a span of three years!
So I was keen to give it a closer look. This post walks through that process. But I should warn you up front that the result is kinda disappointing.
Initial Reservations
Right away some conspicuous omissions stand out.1 A good number of the usual suspects aren’t included, like Philosophical Studies, Analysis, and Australasian Journal of Philosophy. So the usual worries about response rates and selection bias apply.
The data are also a bit haphazard and incomplete. Fewer than half of the journals that responded included gender data. And some of those numbers are suspiciously round.
Still, there’s hope. We have data on over ten thousand submissions even after we exclude journals that didn’t submit any gender data. As long as they paint a reasonably consistent picture, we stand to learn a lot.
First Pass
For starters we’ll just do some minimal cleaning. We’ll exclude data from 2014, since almost no journals supplied it. And we’ll lump together the submissions from the remaining three years, 2011–13, since the gender data isn’t broken down by year.
We can then calculate the following cross-journal tallies for 2011–13:
| Accepted submissions | Rejected submissions | |
|---|---|---|
| Men | 792 | 9104 |
| Women | 213 | 1893 |
The difference here looks notable at first: 17.5% of submitted papers came from women compared with 21.2% of accepted papers, a statistically significant difference (p = 0.002).
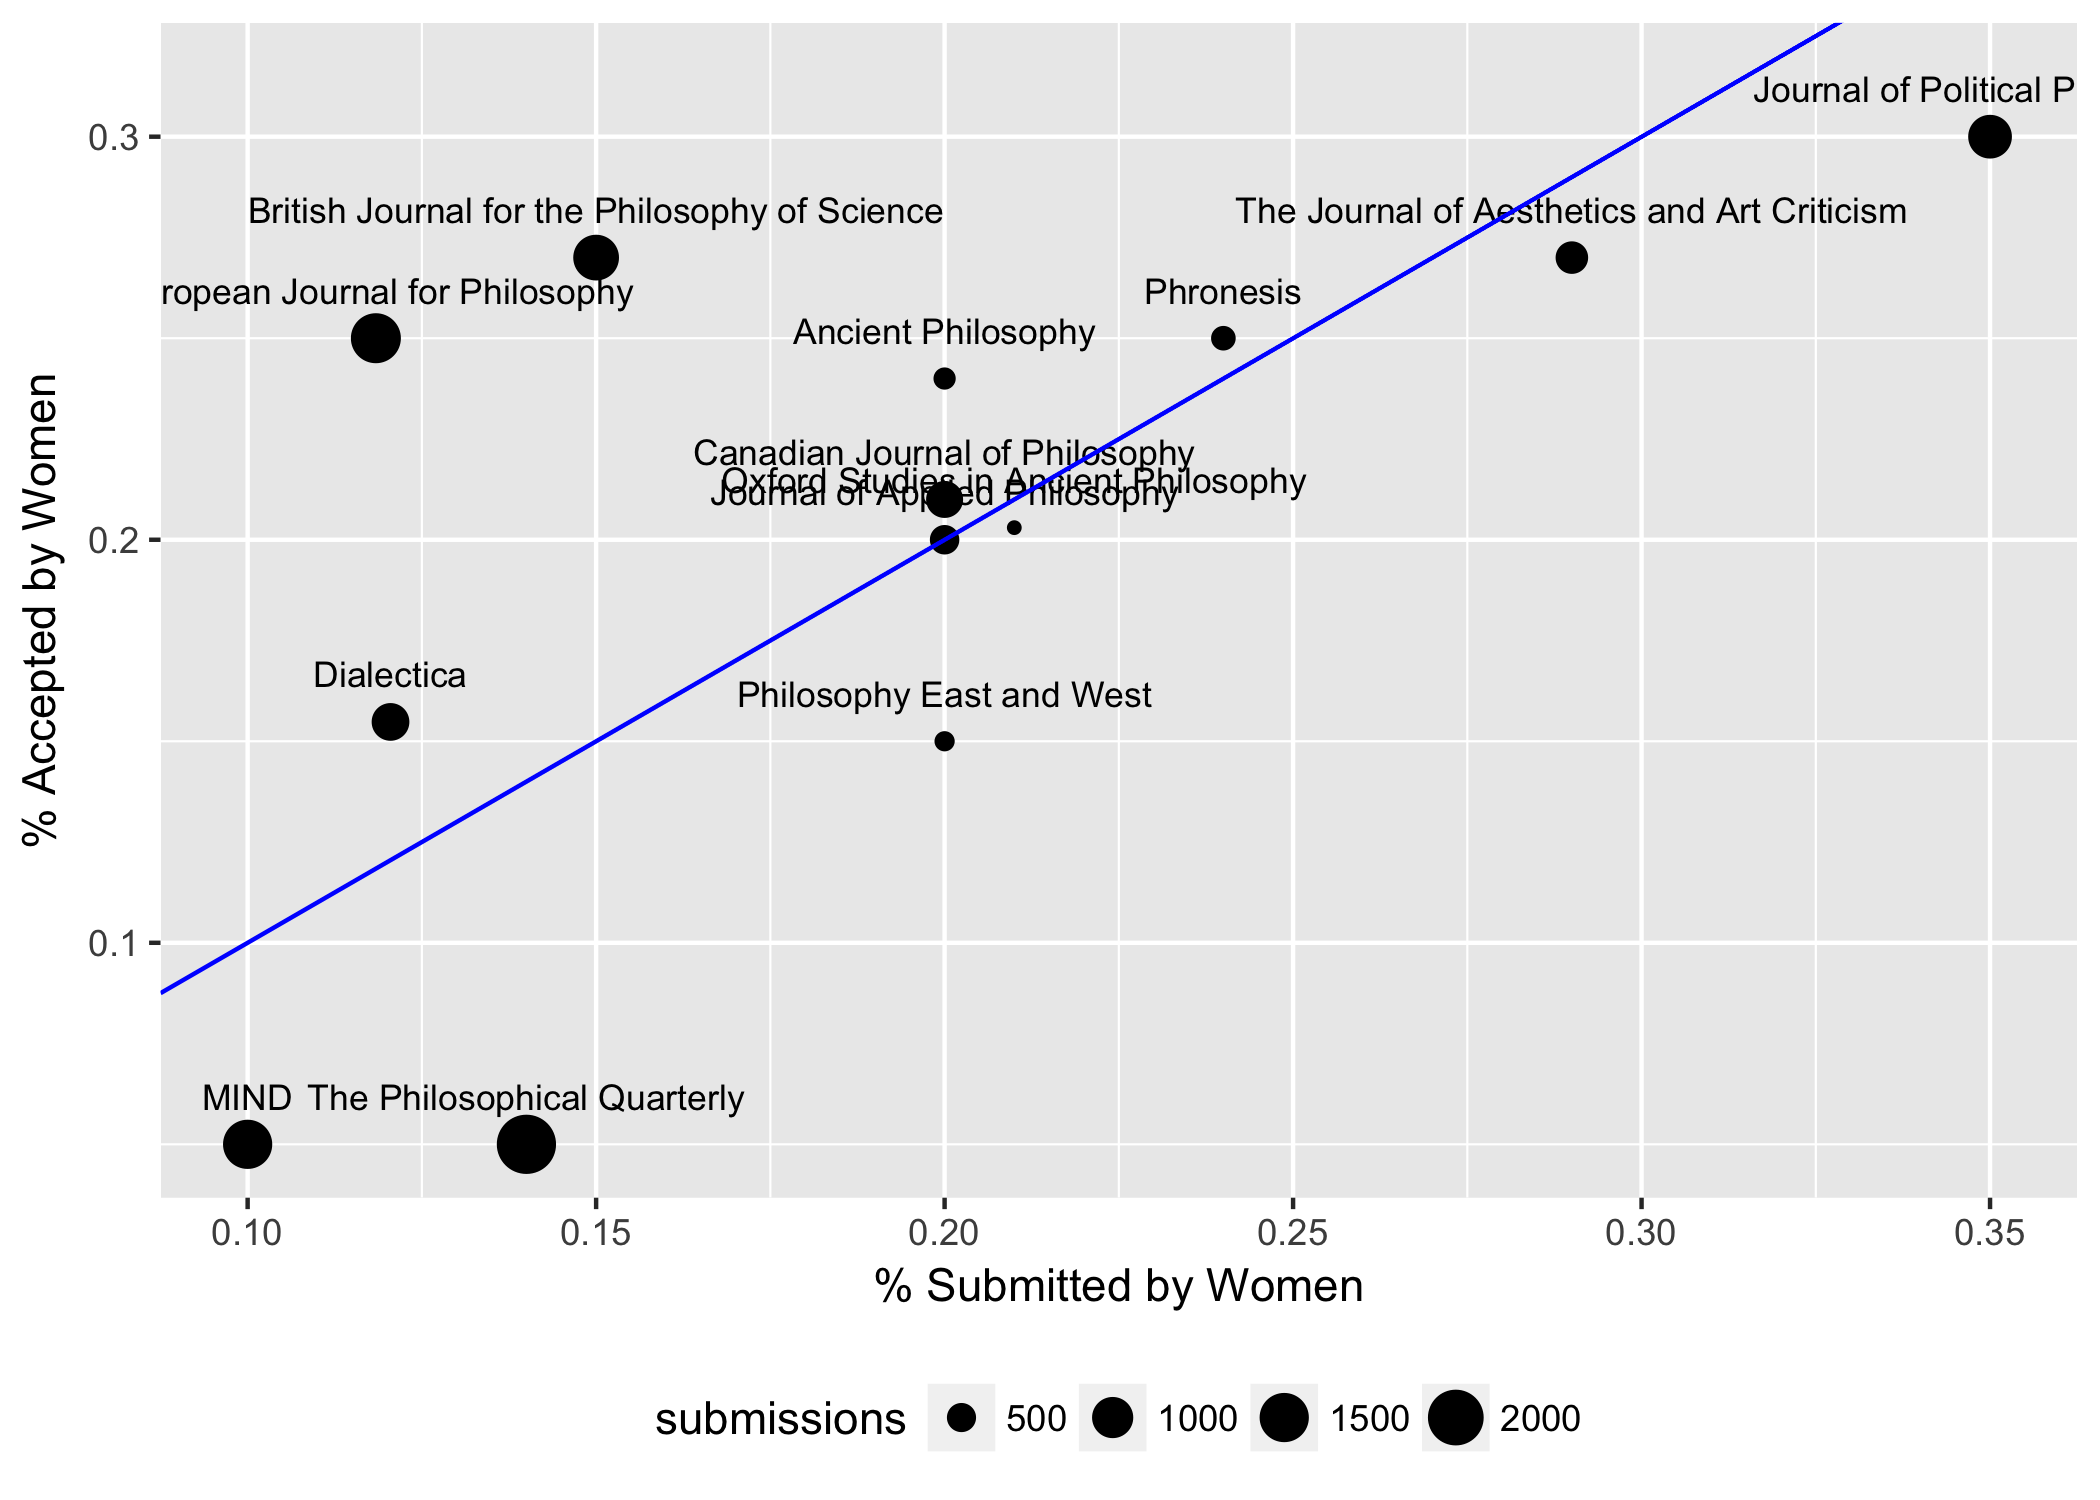
But if we plot the data by journal, the picture becomes much less clear:
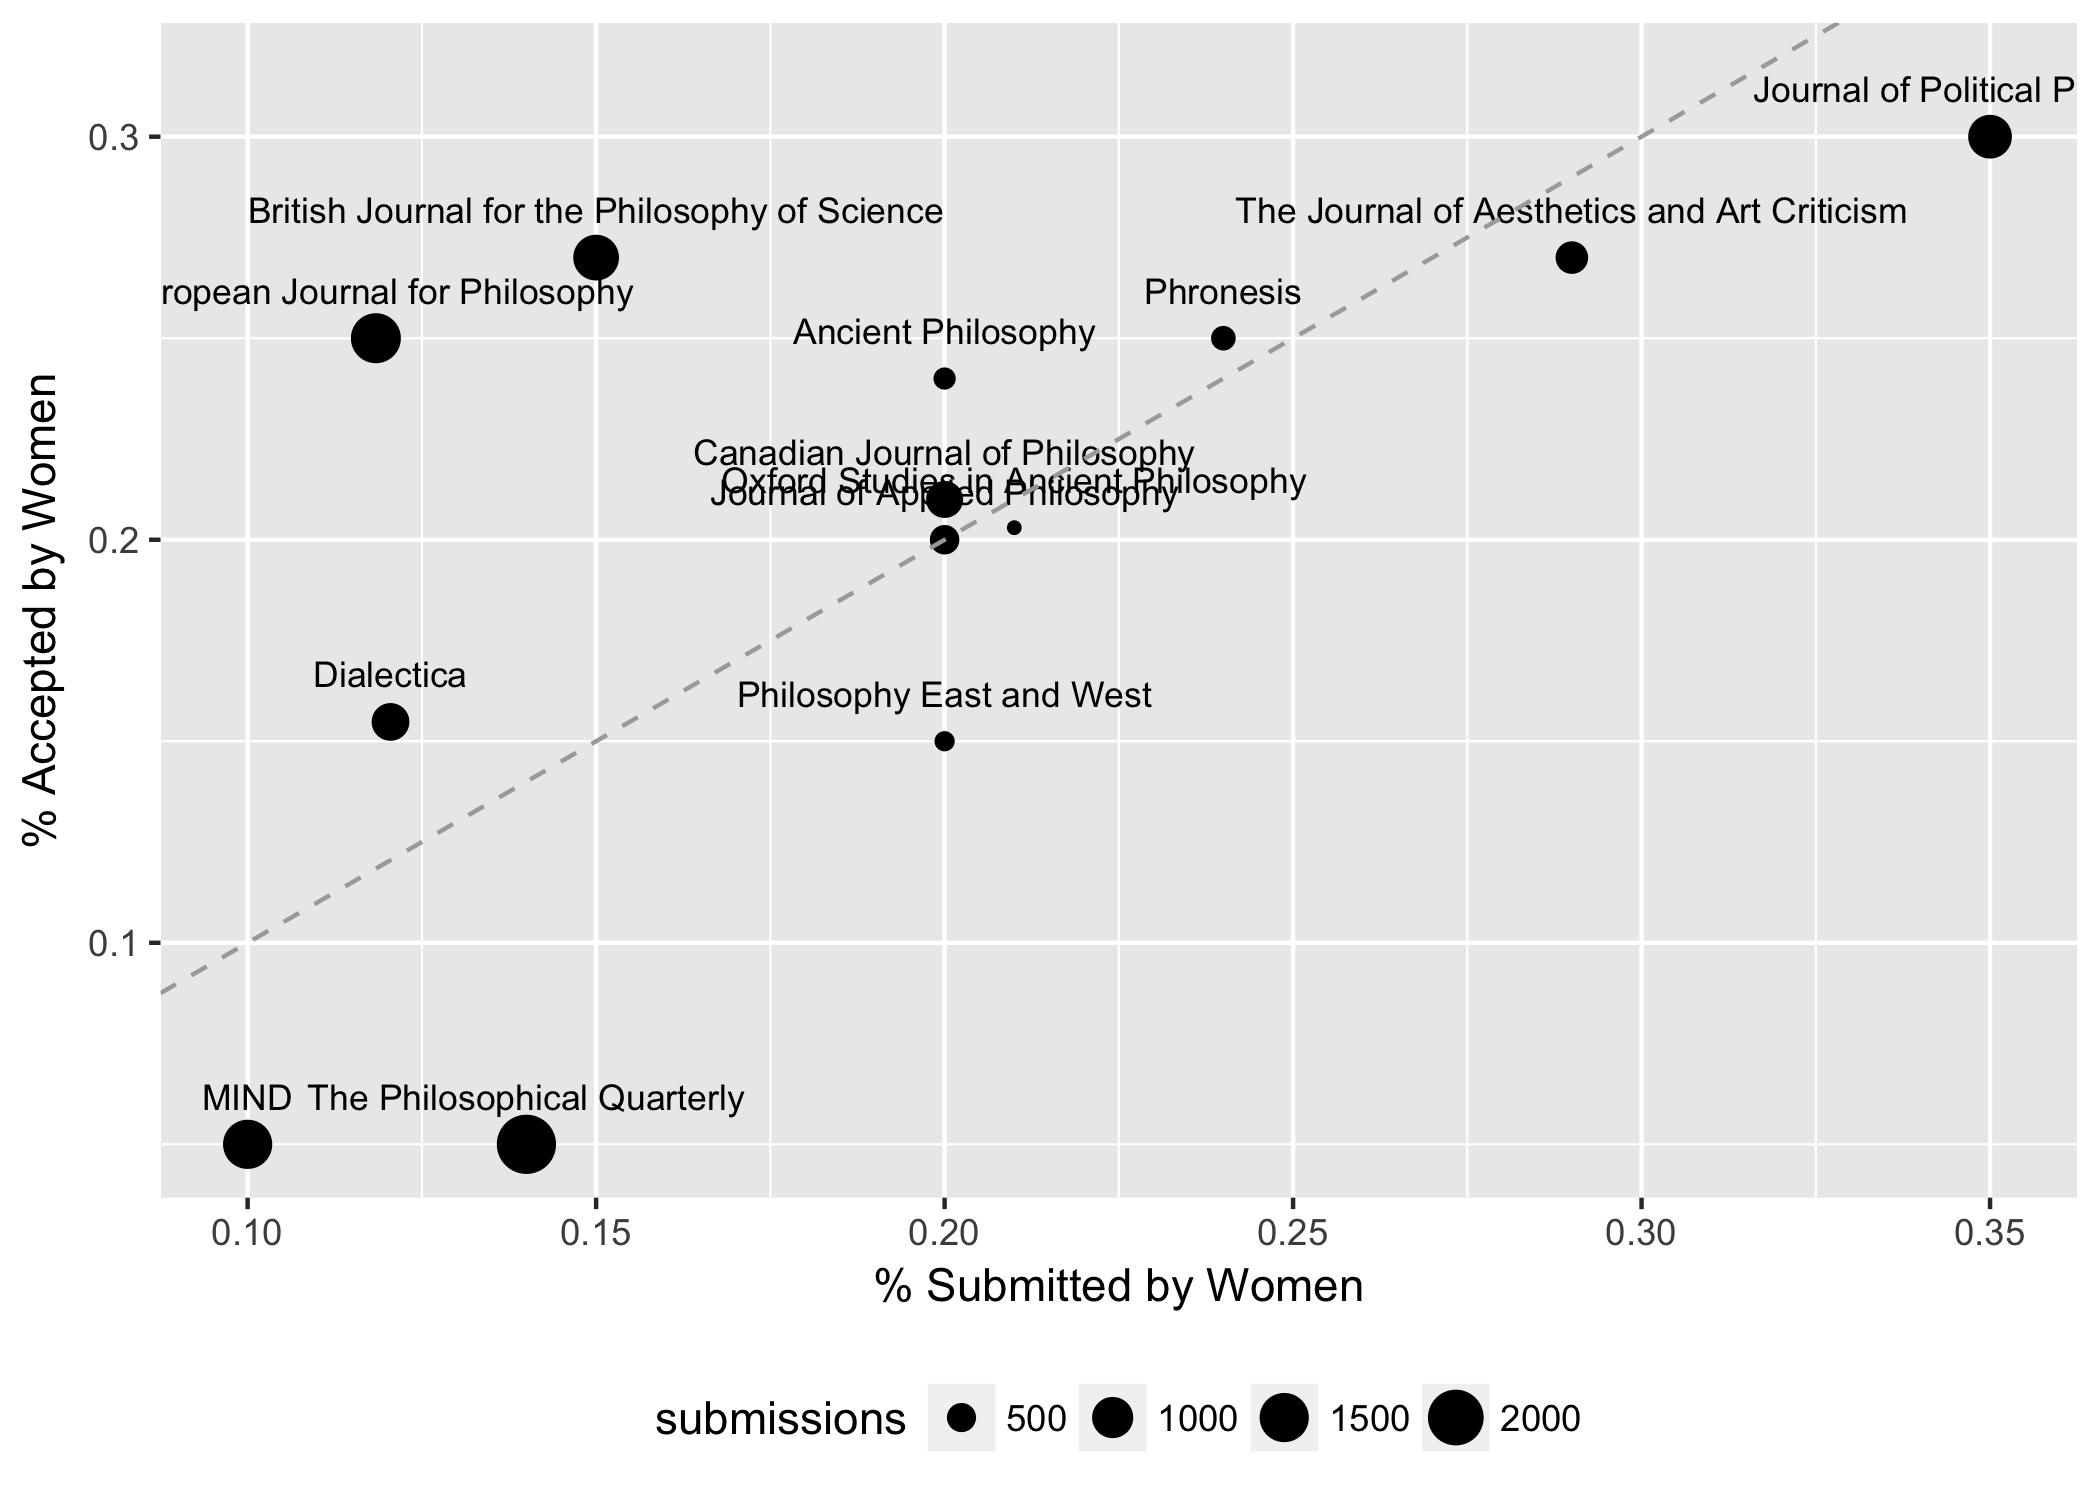
The dashed line2 indicates parity: where submission and acceptance rate would be equal. At journals above the line, women make up a larger portion of published authors than they do submitting authors. At journals below the line, it’s the reverse.
It’s pretty striking how much variation there is between journals. For example, BJPS is 12 points above the parity line while Phil Quarterly is 9 points below it.
It’s also notable that it’s the largest journals which diverge the most from parity: BJPS, EJP, MIND, and Phil Quarterly. (Note: Hume Studies is actually the most extreme by far. But I’ve excluded it from the plot because it’s very small, and as an extreme outlier it badly skews the y-axis.)
It’s hard to see all the details in the plot, so here’s the same data in a table.
| Journal | submissions | accepted | % submissions women | % accepted women |
|---|---|---|---|---|
| Ancient Philosophy | 346 | 63 | 20 | 24 |
| British Journal for the Philosophy of Science | 1267 | 117 | 15 | 27 |
| Canadian Journal of Philosophy | 792 | 132 | 20 | 21 |
| Dialectica | 826 | 74 | 12.05 | 15.48 |
| European Journal for Philosophy | 1554 | 98 | 11.84 | 25 |
| Hume Studies | 152 | 30 | 23.7 | 58.1 |
| Journal of Applied Philosophy | 510 | 47 | 20 | 20 |
| Journal of Political Philosophy | 1143 | 53 | 35 | 30 |
| MIND | 1498 | 74 | 10 | 5 |
| Oxford Studies in Ancient Philosophy | 290 | 43 | 21 | 20.3 |
| Philosophy East and West | 320 | 66 | 20 | 15 |
| Phronesis | 388 | 38 | 24 | 25 |
| The Journal of Aesthetics and Art Criticism | 611 | 93 | 29 | 27 |
| The Philosophical Quarterly | 2305 | 77 | 14 | 5 |
Rounders Removed
I mentioned that some of the numbers look suspiciously round. Maybe 10% of submissions to MIND really were from women, compared with 5% of accepted papers. But some of these cases probably involve non-trivial rounding, maybe even eyeballing or guesstimating. So let’s see how things look without them.
If we omit journals where both percentages are round (integer multiples of 5), that leaves ten journals. And the gap from before is even more pronounced: 16.3% of submissions from women compared with 22.9% of accepted papers (p = 0.0000003).
But it’s still a few, high-volume journals driving the result: BJPS and EJP do a ton of business, and each has a large gap. So much so that they’re able to overcome the opposite contribution of Phil Quarterly (which does a mind-boggling amount of business!).
Editors Anonymous
Naturally I fell to wondering how these big journals differ in their editorial practices. What are they doing differently that leads to such divergent results?
One thing the data tell us is which journals practice fully anonymous review, with even the editors ignorant of the author’s identity. That narrows it down to just three journals: CJP, Dialectica, and Phil Quarterly.3 The tallies then are:
| Accepted submissions | Rejected submissions | |
|---|---|---|
| Men | 240 | 3103 |
| Women | 43 | 537 |
And now the gap is gone: 14.8% of submissions from women, compared with 15.2% of accepted papers—not a statistically significant difference (p = 0.91). That makes it look like the gap is down to editors’ decisions being influenced by knowledge of the author’s gender (whether deliberately or unconsciously).
But notice again, Phil Quarterly is still a huge part of this story. It’s their high volume and unusually negative differential that compensates for the more modest, positive differentials at CJP and Dialectica. So I still want to know more about Phil Quarterly, and what might explain their unusually negative differential.
Edit: editors at CJP and Phil Quarterly kindly wrote with the following, additional information.
At CJP, the author’s identity is withheld from the editors while they decide whether to send the paper for external review, but then their identity is revealed (presumably to avoid inviting referees who are unacceptably close to the author—e.g. those identical to the author).
And chairman of Phil Quarterly’s editorial board, Jessica Brown, writes:
- the PQ is very aware of issues about the representation of women, unsurprisingly given that the editorial board consists of myself, Sarah Broadie and Sophie-Grace Chappell. We monitor data on submissions by women and papers accepted in the journal every year.
- the PQ has for many years had fully anonymised processing including the point at which decisions on papers are made (i.e. accept, reject, R and R etc). So, when we make such decisions we have no idea of the identity of the author.
While in some years the data has concerned us, more recently the figures do look better which is encouraging:
- 16-17: 25% declared female authored papers accepted; 16% submissions
- 15-16: 14% accepted; 15% submissions
- 14-15: 16% accepted; 16% submissions
A Gruesome Conclusion
In the end, I don’t see a clear lesson here. Before drawing any conclusions from the aggregated, cross-journal tallies, it seems we’d need to know more about the policies and practices of the journals driving them. Otherwise we’re liable to be misled to a false generalization about a heterogeneous group.
Some of that policy-and-practice information is probably publicly available; I haven’t had a chance to look. And I bet a lot of it is available informally, if you just talk to the right people. So this data-set could still be informative on our base-rate question. But sadly, I don’t think I’m currently in a position to make informative use of it.

Technical Note
This post was written in R Markdown and the source is available on GitHub.
- No, I don’t mean Ergo! We published our first issue in 2014 while the survey covers mainly 2011–13. [return]
- Edit: the parity line was solid blue originally. But that misled some people into reading it as a fitted line. For reference and posterity, the original image is here. [return]
- That’s if we continue to exclude journals with very round numbers. Adding these journals back in doesn’t change the following result, though. [return]