In 2009 Andrew Cullison set up an ongoing survey for philosophers to report their experiences submitting papers to various journals. For me, a junior philosopher working toward tenure at the time, it was a great resource. It was the best guide I knew to my chances of getting a paper accepted at Journal X, or at least getting rejected quickly by Journal Y.
But I always wondered about self-selection bias. I figured disgruntled authors were more likely to use the survey to vent. So I wondered whether the data overestimated things like wait times and rejection rates.
This post is an attempt to better understand the survey data, especially through visualization and comparisons with other sources.
Timeline
The survey has accrued 7,425 responses as of this writing. Of these, 720 have no date recorded. Here’s the timeline for the rest:
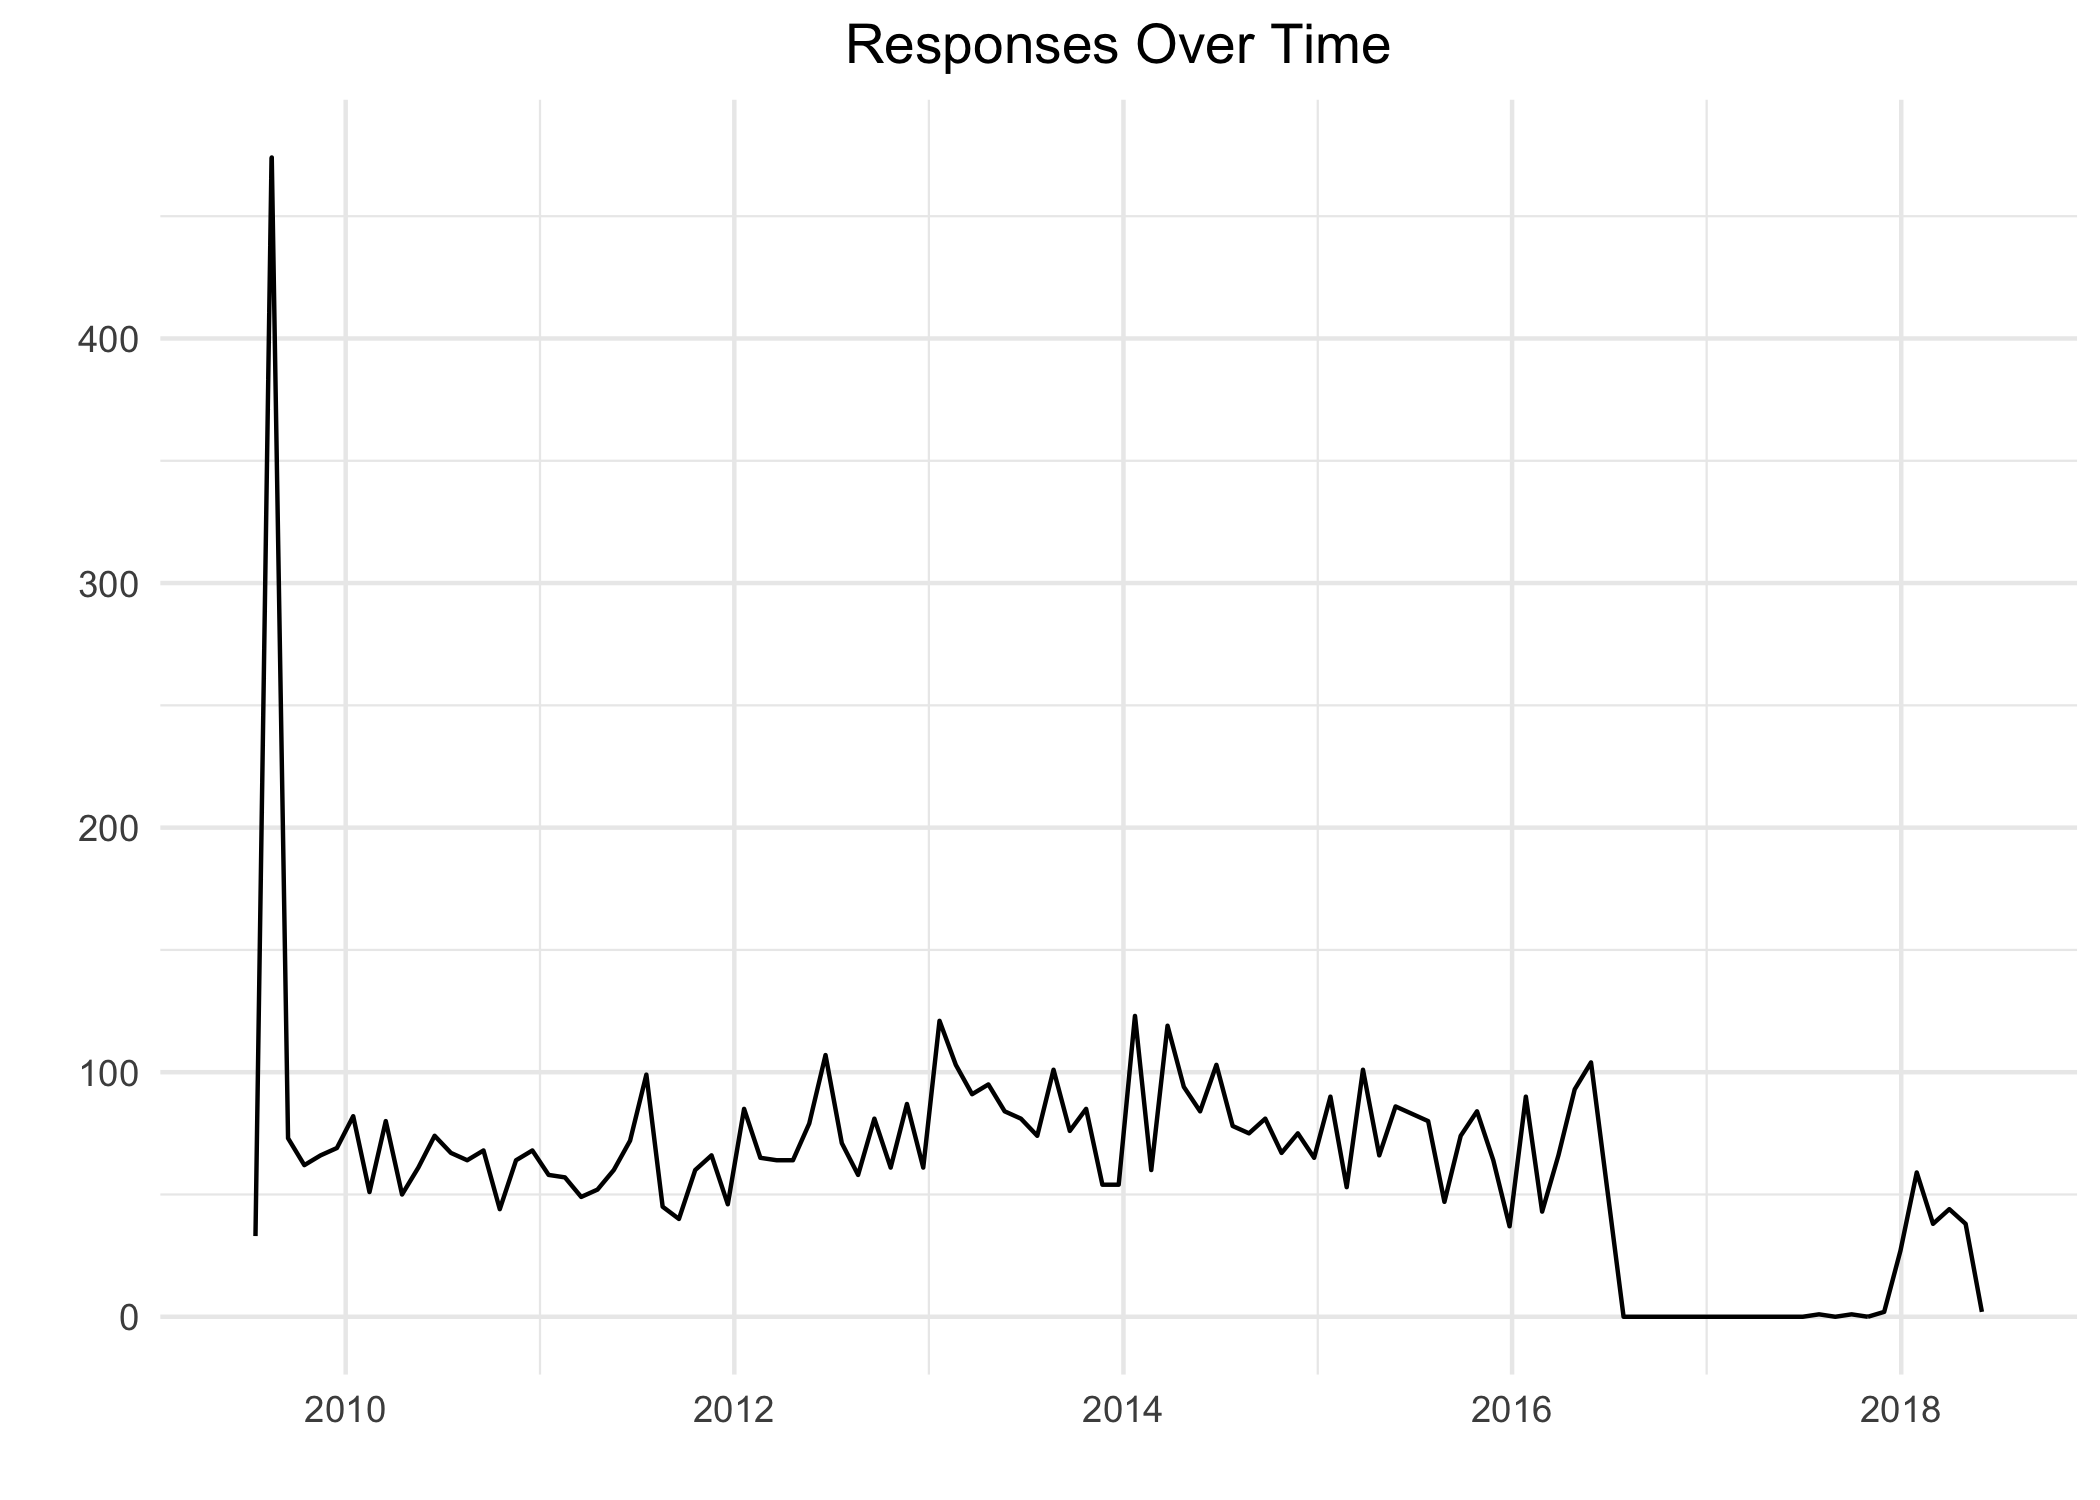
Two things jump out right away: the spike at the beginning and the dead zone near the end. What gives?
I’m guessing the spike reflects records imported manually from another source at the survey’s inception. Here I’ll mostly assume these records are legitimate, and include them in our analyses. But since the dates attached to those responses are certainly wrong, I’ll exclude them when we get to temporal questions (toward the end of the post).
What about the 2016–17 dead zone? I tried contacting people involved with the surveys, but nobody seemed to really know for sure what happened there. This dead period is right around when the surveys were handed over to the APA. In that process the data were moved to a different hosting service, apparently with some changes to the survey format. So maybe the records for this period were lost in translation.
In any case, it looks like the norm is for the survey to get around 50 to 100 responses each month.
Journals
There are 155 journals covered by the survey, but most have only a handful of responses. Here are the journals with 50 or more:
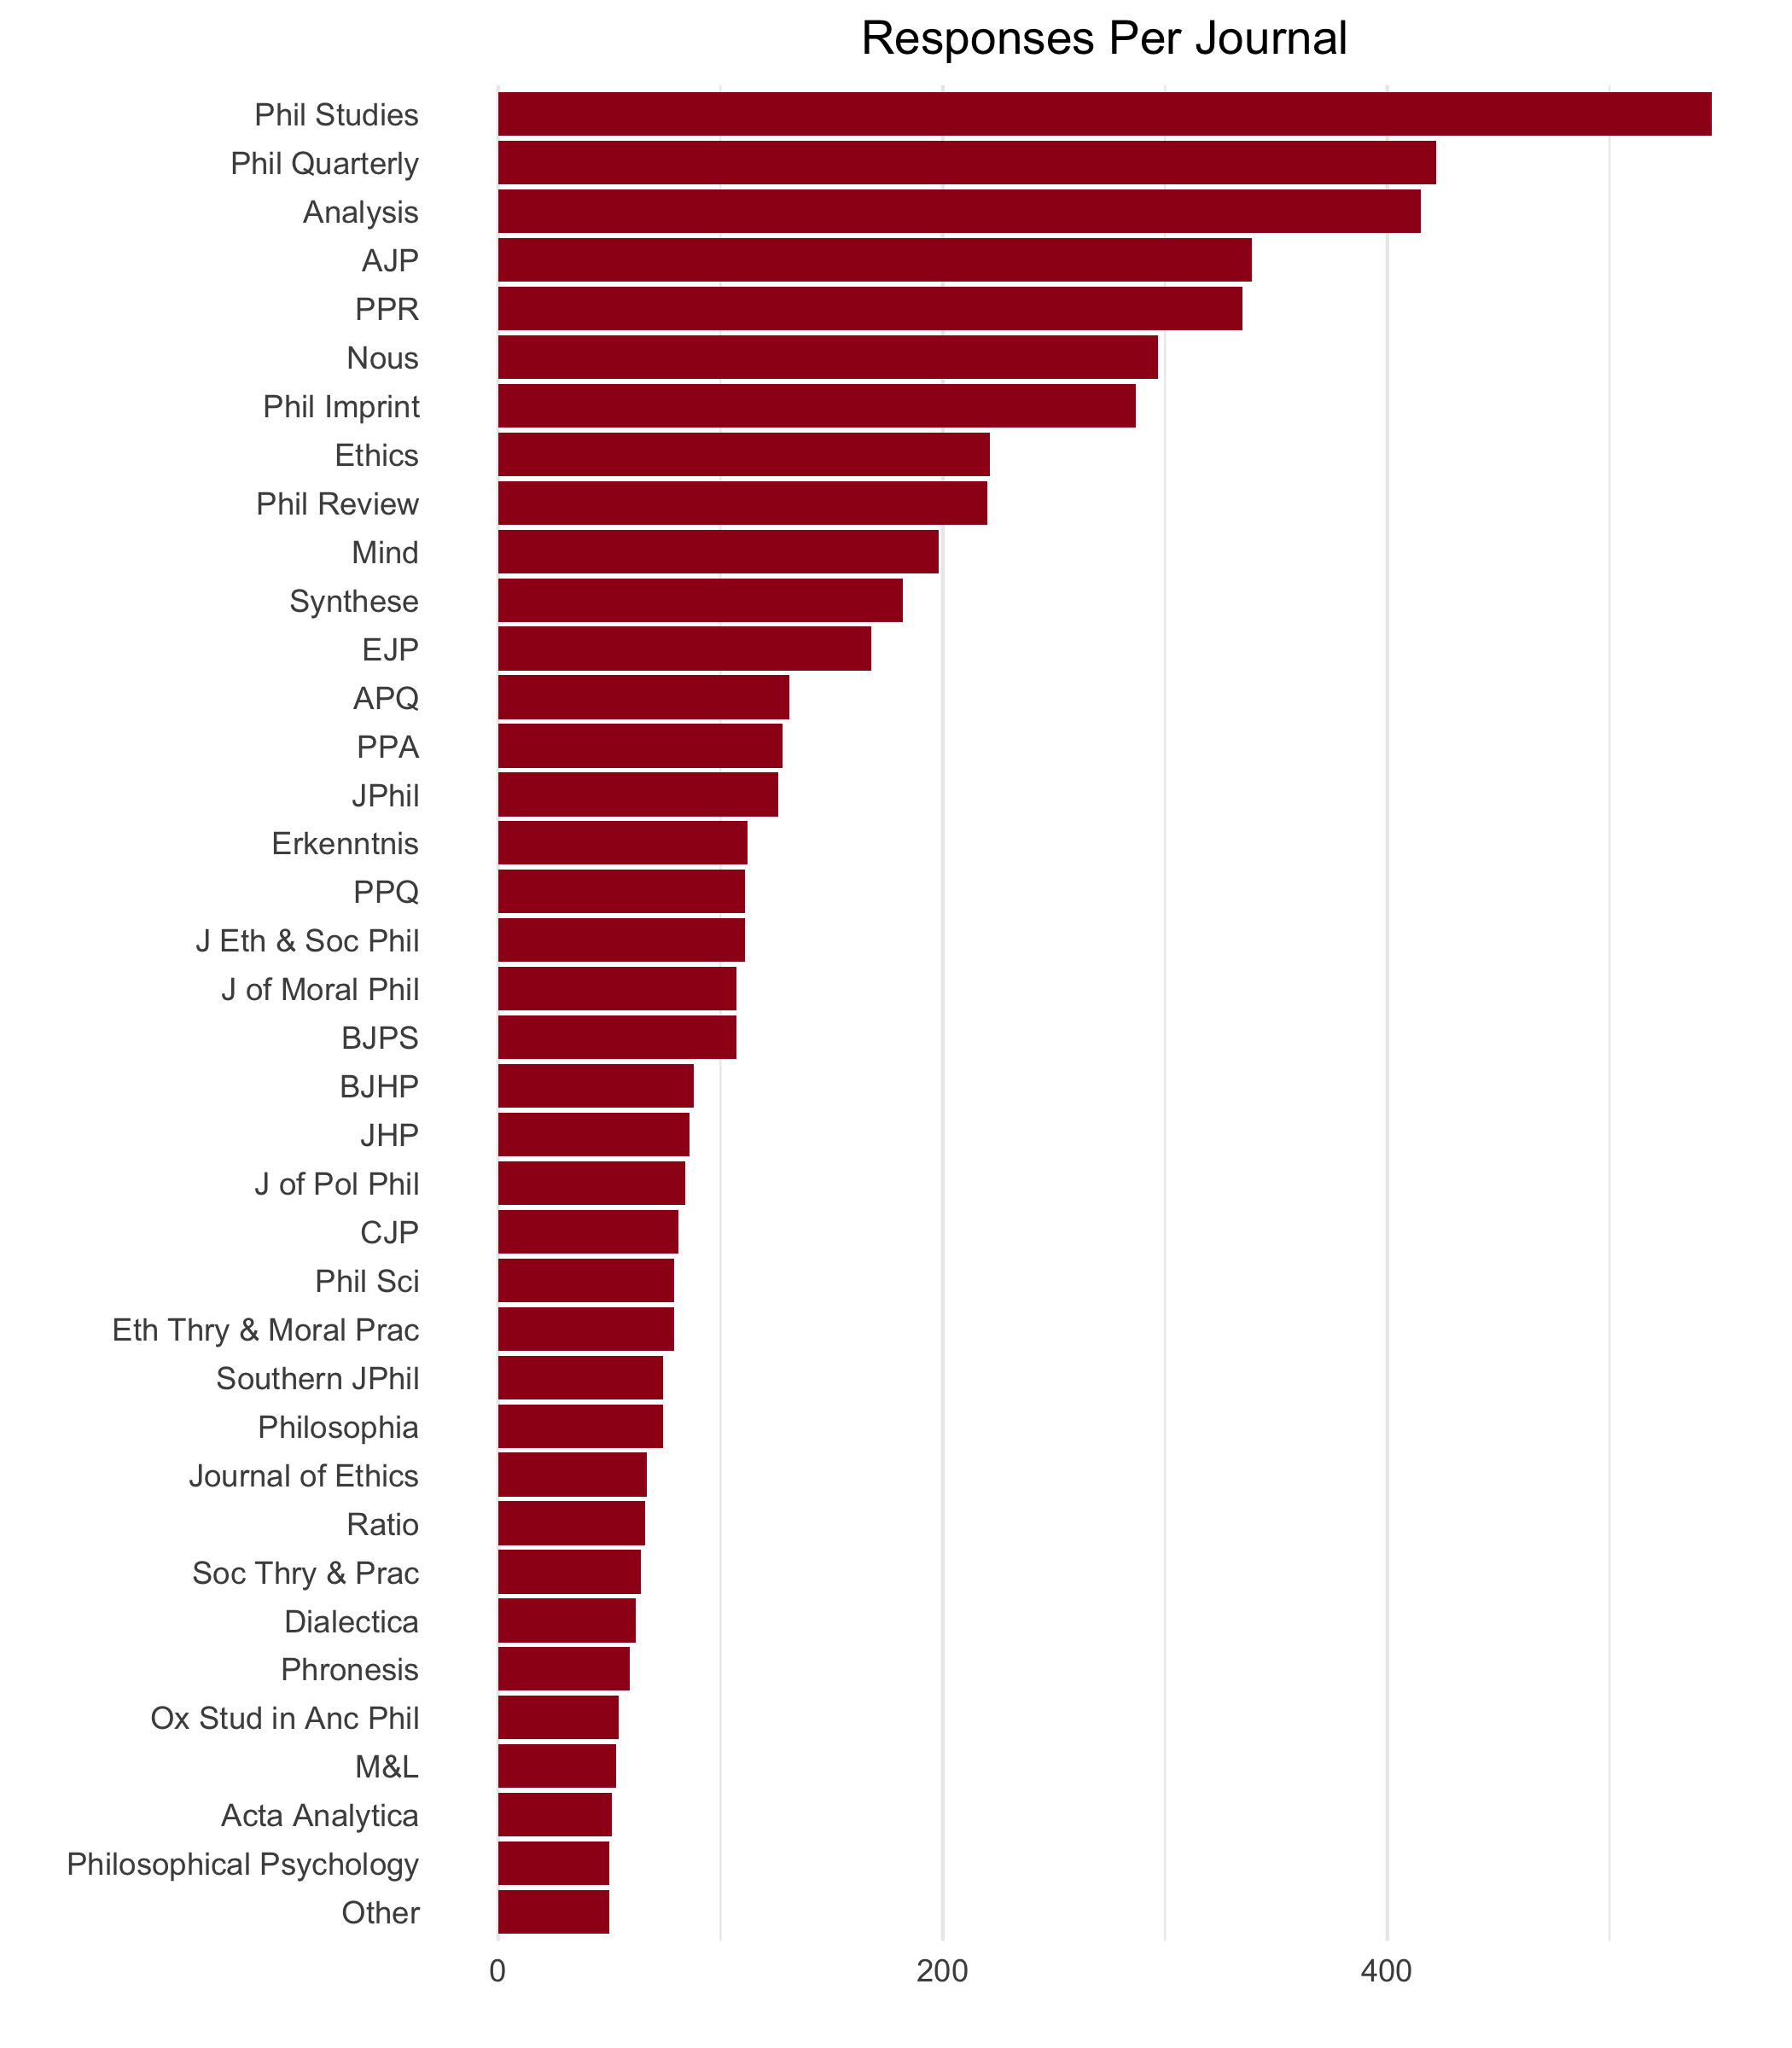
How do these numbers compare to the ground truth? Do Phil Studies and Phil Quarterly really get the most submissions, for example? And do they really get 4–5 times as many as, say, BJPS?
One way to check is to compare these numbers with those reported by the journals themselves to the APA and BPA in this study from 2011–13. Phil Studies isn’t included in that report unfortunately, but Phil Quarterly and BJPS are. They reported receiving 2,305 and 1,267 submissions, respectively, during 2011–13. So Phil Quarterly does seem to get a lot more submissions, though not 4 times as many.
For a fuller picture let’s do the same comparison for all journals that reported their submission totals to the APA/BPA. That gives us a subset of 33 journals. If we look at the number of survey responses for these journals over the years 2011–2013, we can get a sense of how large each journal looms in the Journal Survey vs. the APA/BPA report:
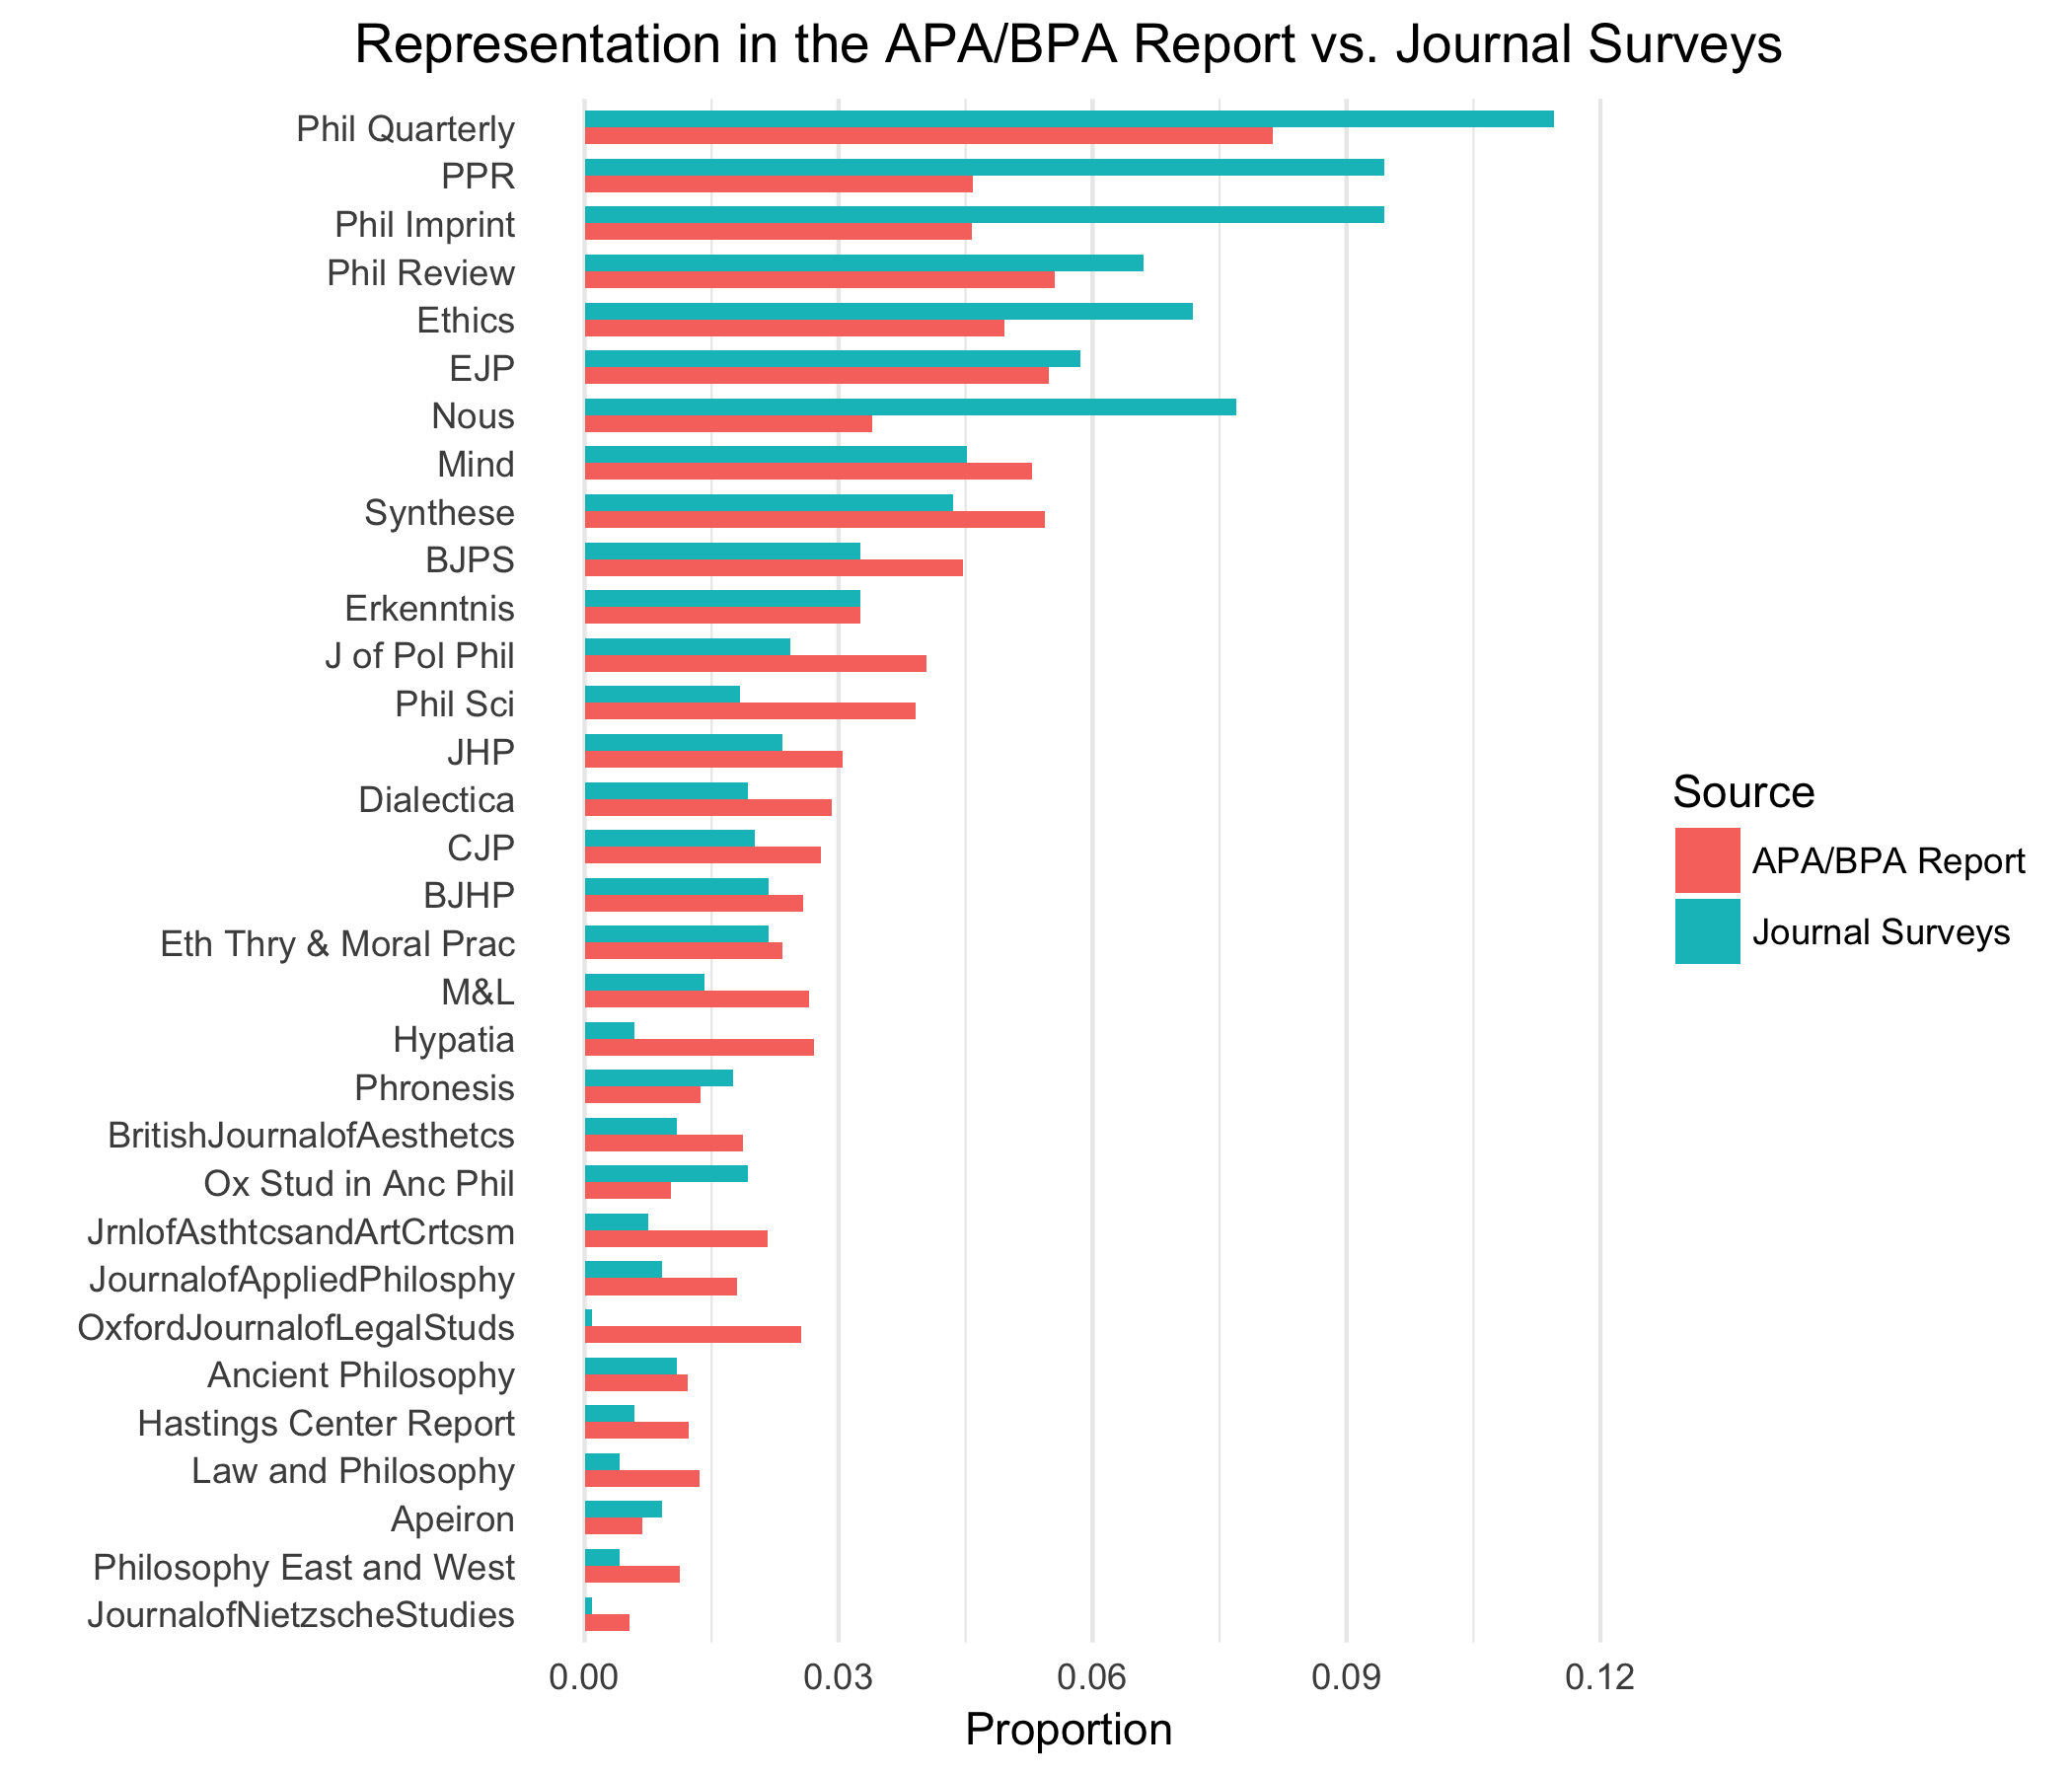
There’s a pretty a strong correlation evident here. But it’s also clear there’s some bias in the survey responses. Bias towards what? I’m not exactly sure. Roughly the pattern seems to be that the more submissions a journal receives, the more likely it is to be overrepresented in the survey. But it might instead be a bias towards generalist journals, or journals with fast turn around times. This question would need a more careful analysis, I think.
Acceptance Rates
What about acceptance rates? Here are the acceptance rates for those journals with 30+ responses in the survey:
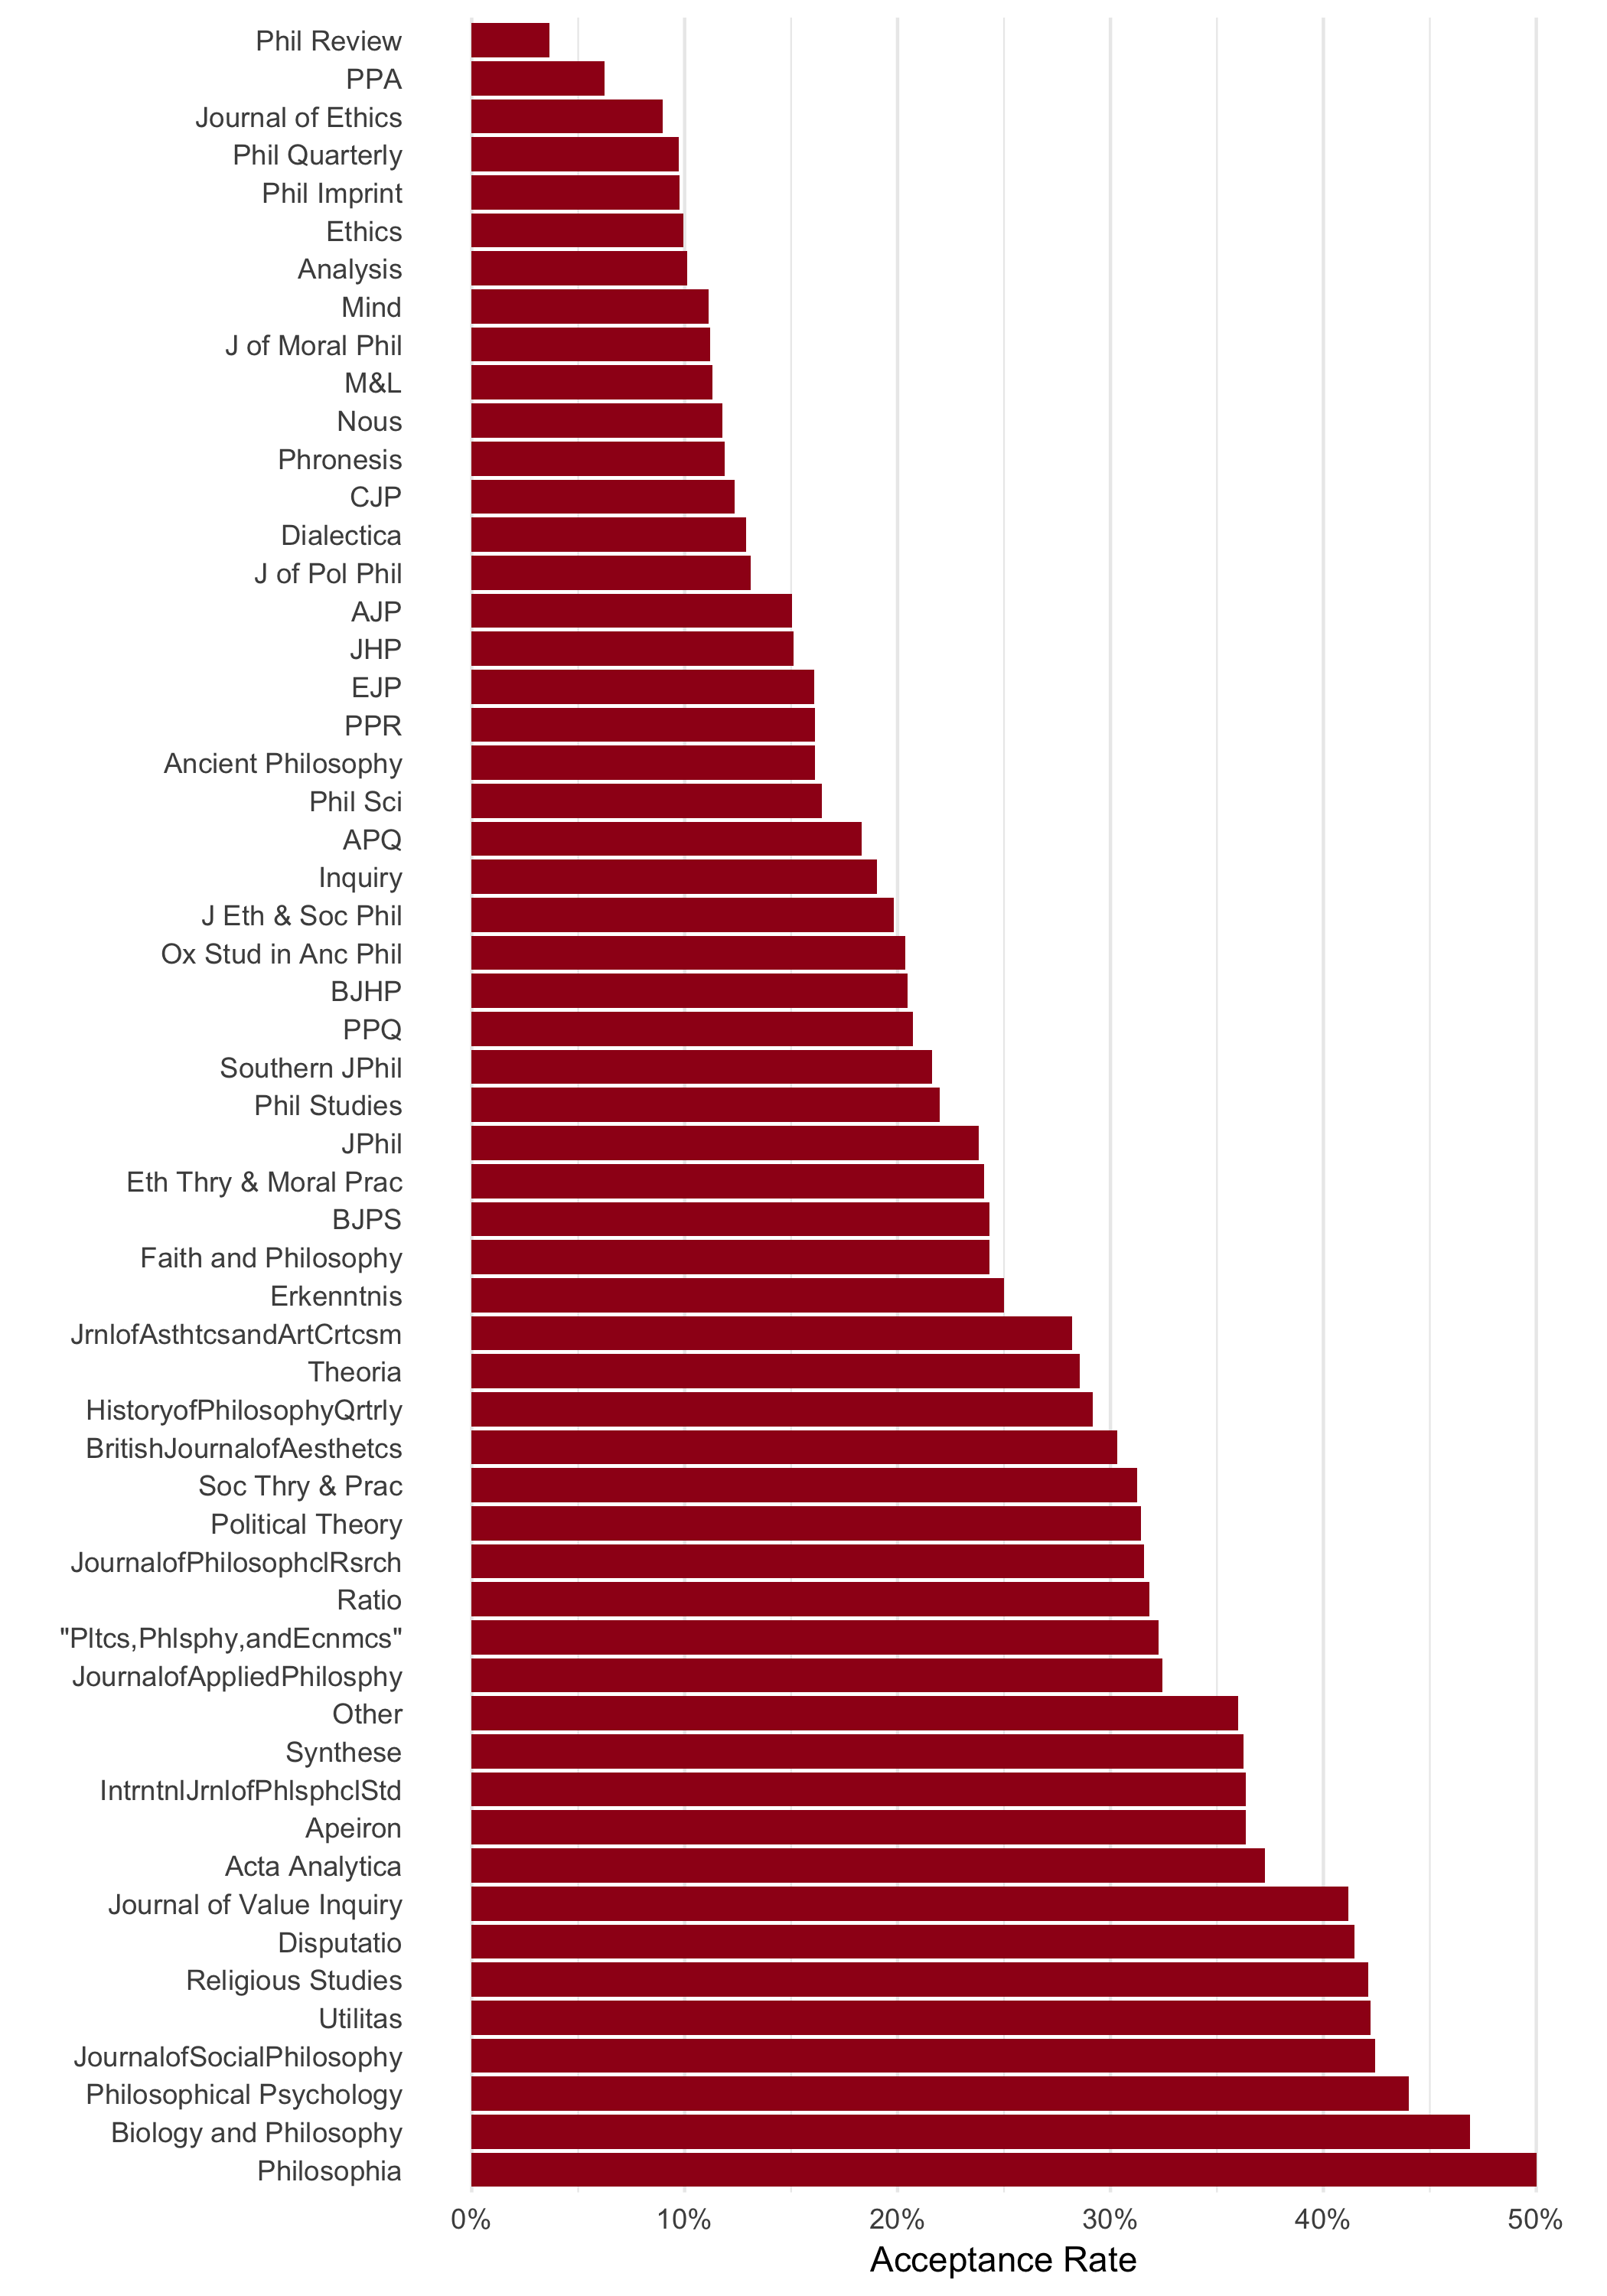
These numbers look suspiciously high to me. Most philosophy journals I know have an acceptance rate under 10%. So let’s compare with an outside source again.
The most comprehensive list of acceptance rates I know is this one based on data from the ESF. It’s not as current as I’d like (2011), nor as complete (Phil Imprint isn’t included, perhaps too new at the time). It’s also not entirely accurate: it reports an acceptance rate of 8% for Phil Quarterly vs. 3% reported in the APA/BPA study.
Still, the ESF values do seem to be largely accurate for many prominent journals I’ve checked. For example, they’re within 1 or 2% of the numbers reported elsewhere by Ethics, Mind, Phil Review, JPhil, Nous, and PPR.1 So they’re useful for at least a rough validation.
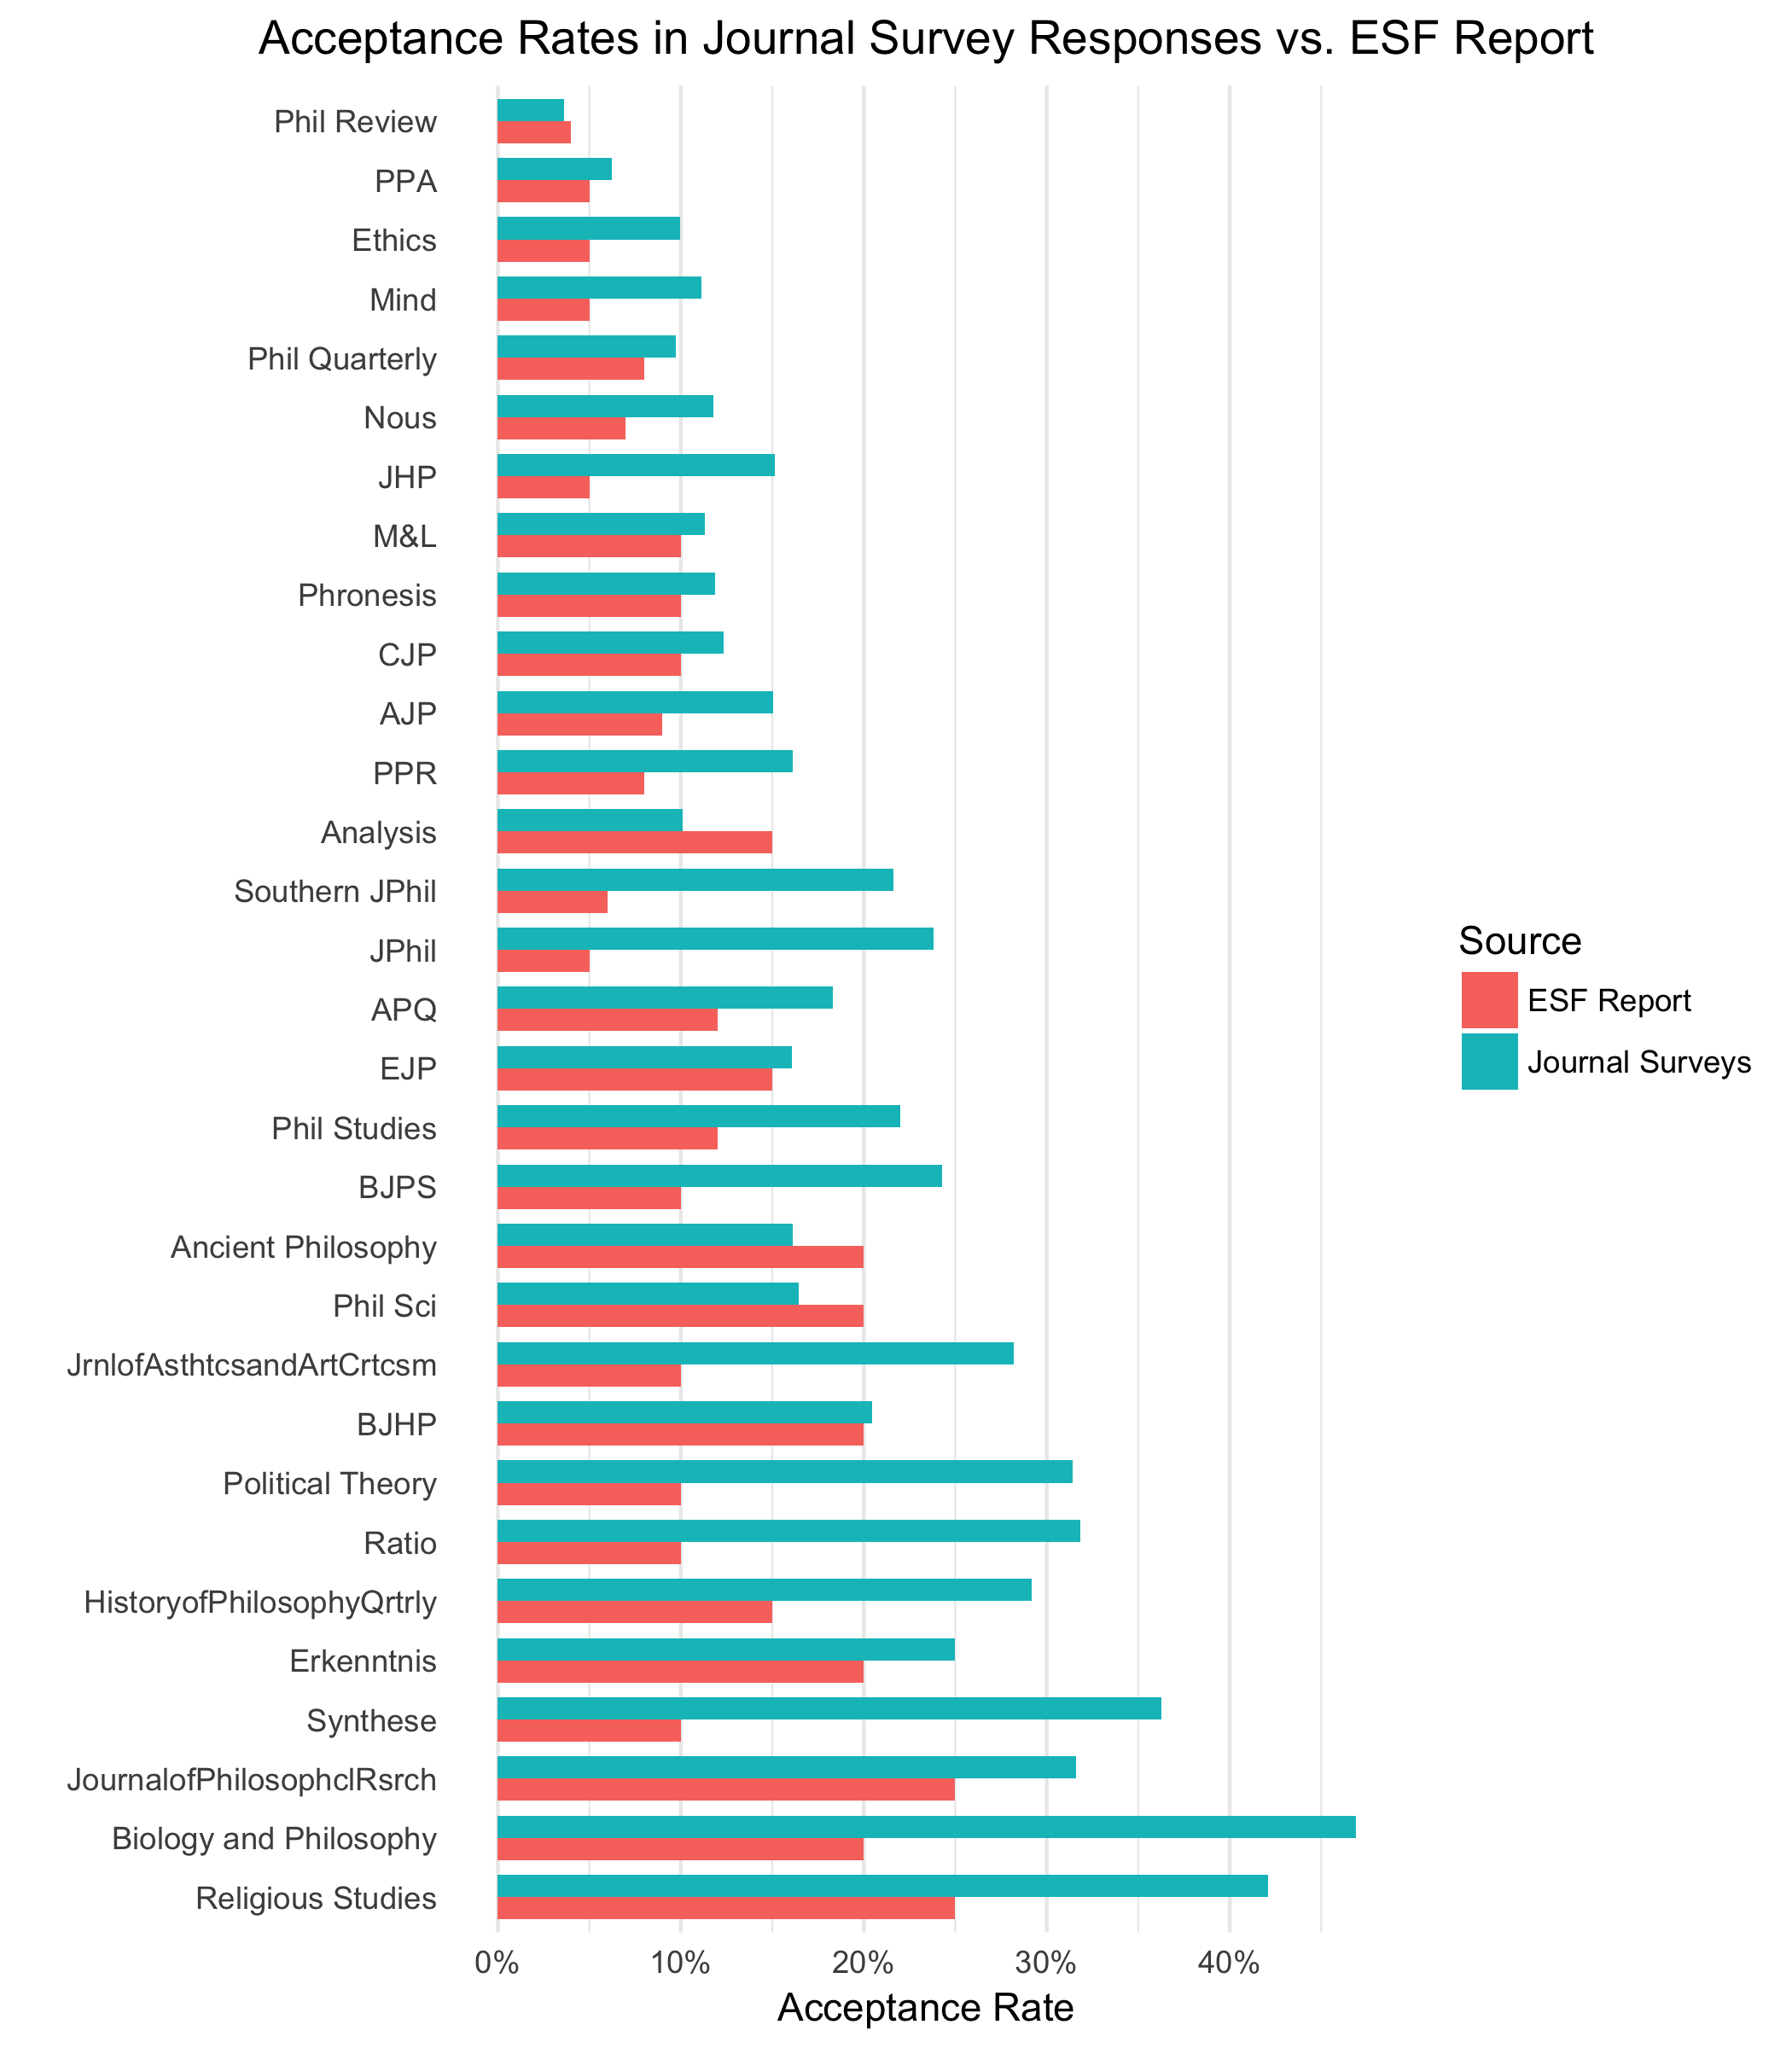
Apparently the Journal Surveys do overrepresent accepted submissions. Consistently so in fact: with the exception of Phil Review, Analysis, Ancient Philosophy, and Phil Sci, the surveys overrepresent accepted submissions for every other journal in this comparison. And in many cases accepted submissions are drastically overrepresented.
This surprised me, since I figured the surveys would serve as an outlet for disgruntled authors. But maybe it’s the other way around: people are more likely to use the surveys as a way to share happy news. (Draw your own conclusions about human nature.)
Seniority
So who uses the journal surveys: grad students? Faculty? The survey records five categories: Graduate Student, Non-TT Faculty, TT-but-not-T Faculty, Tenured Faculty, and Other. A few entries have no professional position recorded.
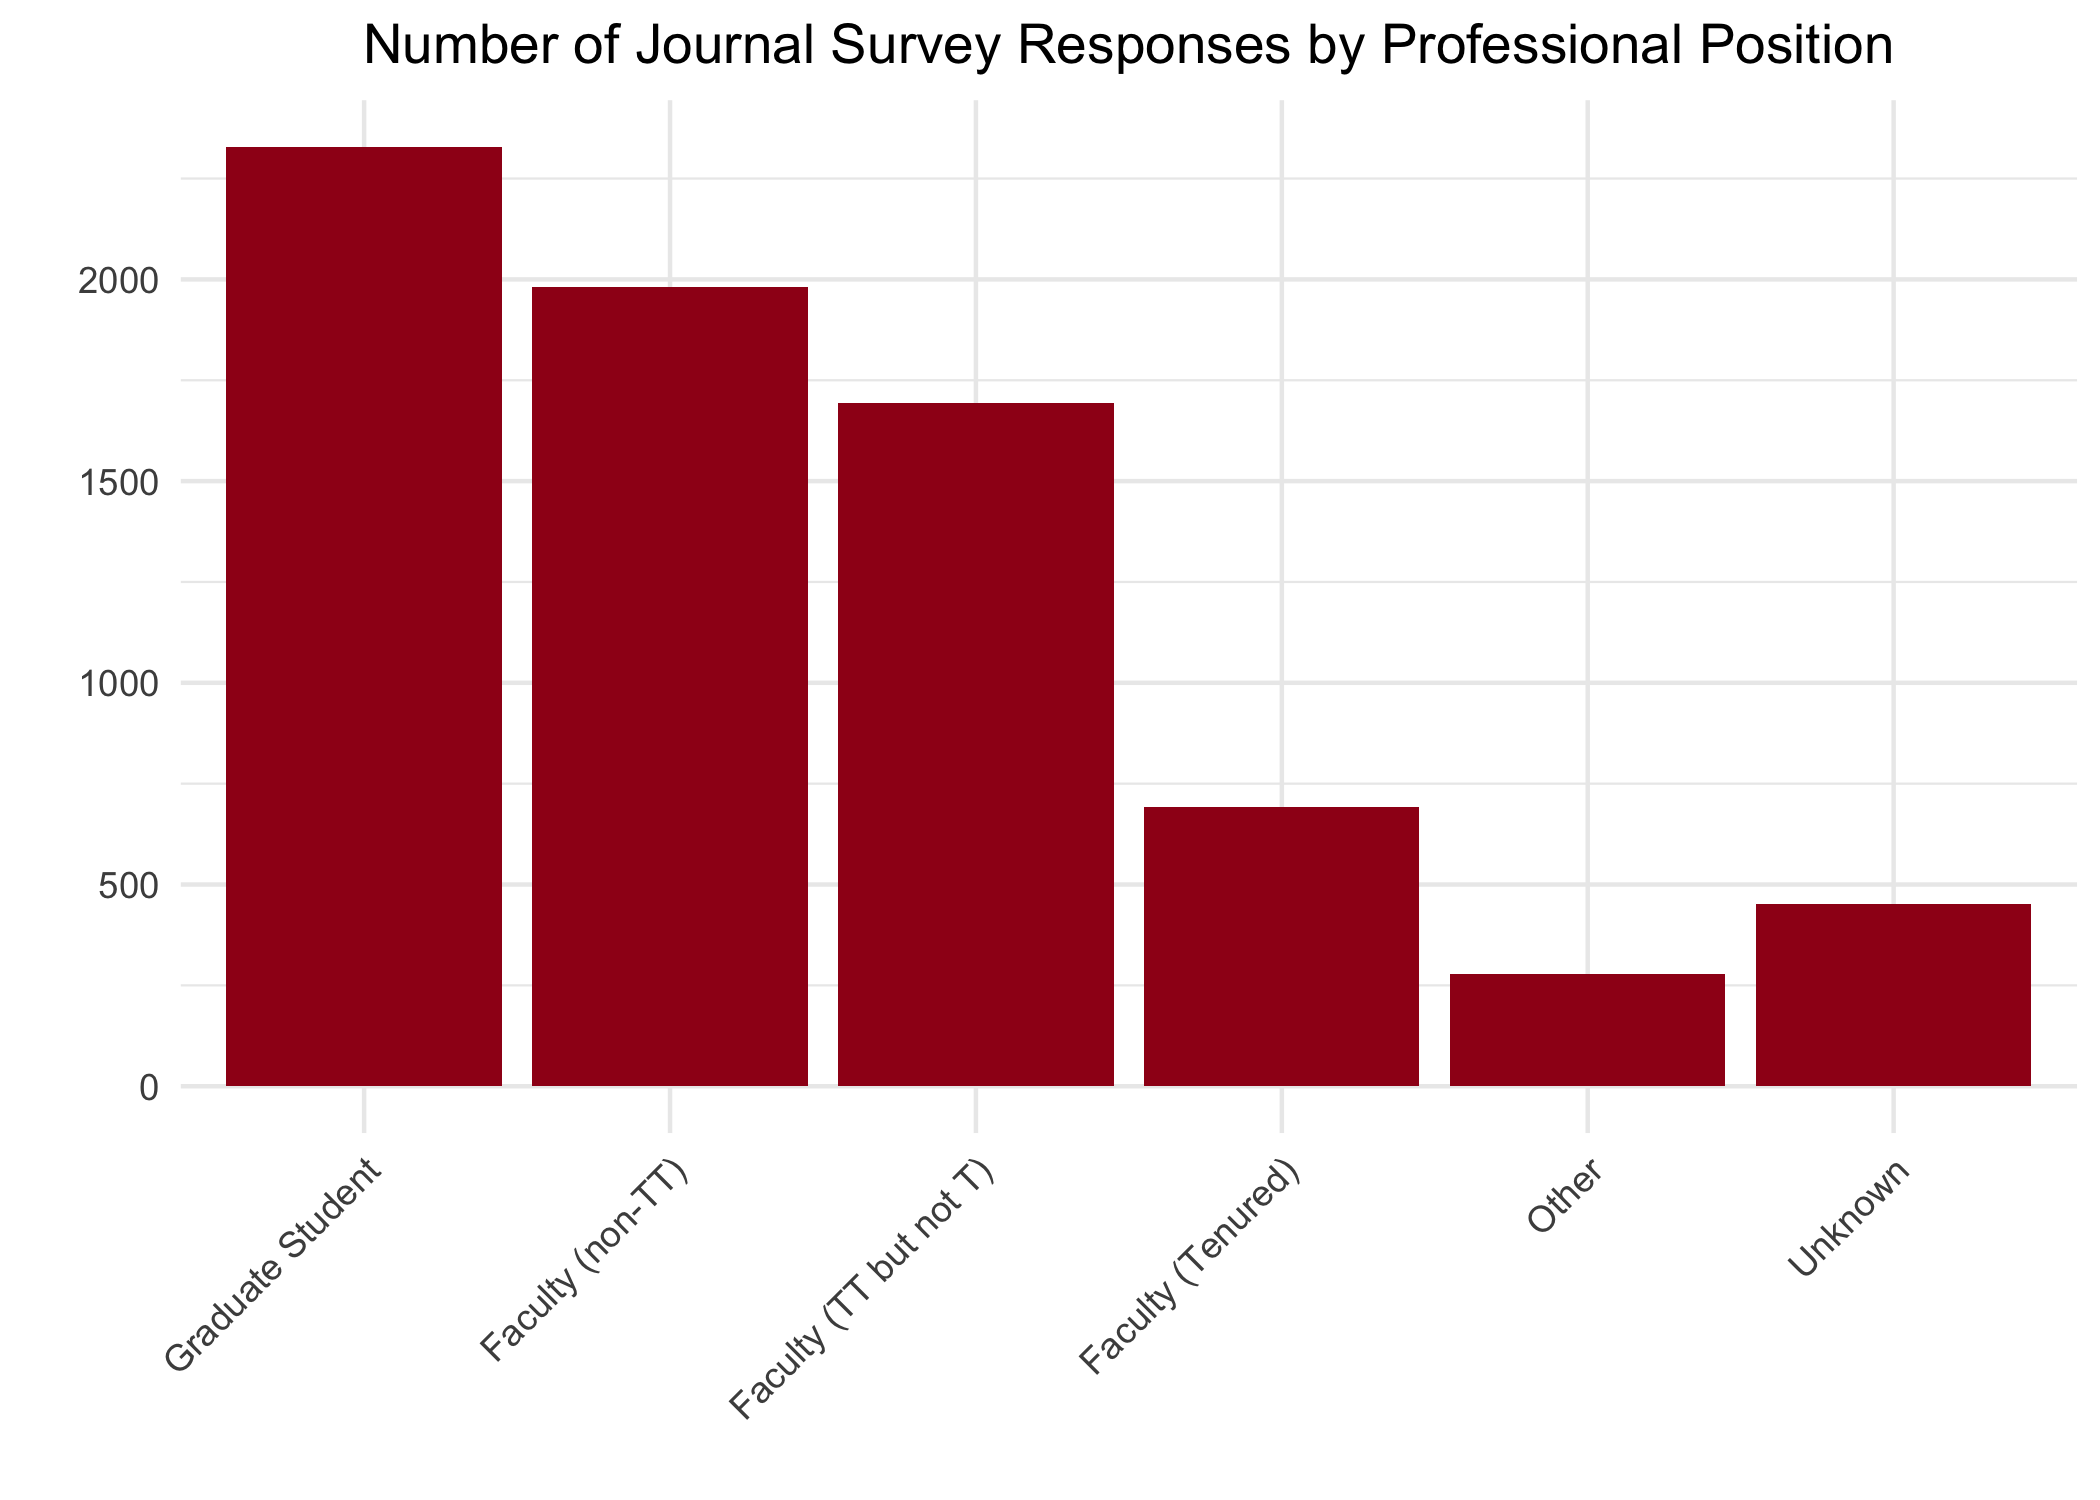
Evidently, participation drops off with seniority. Also interesting if not too terribly surprising is that seniority affects acceptance:
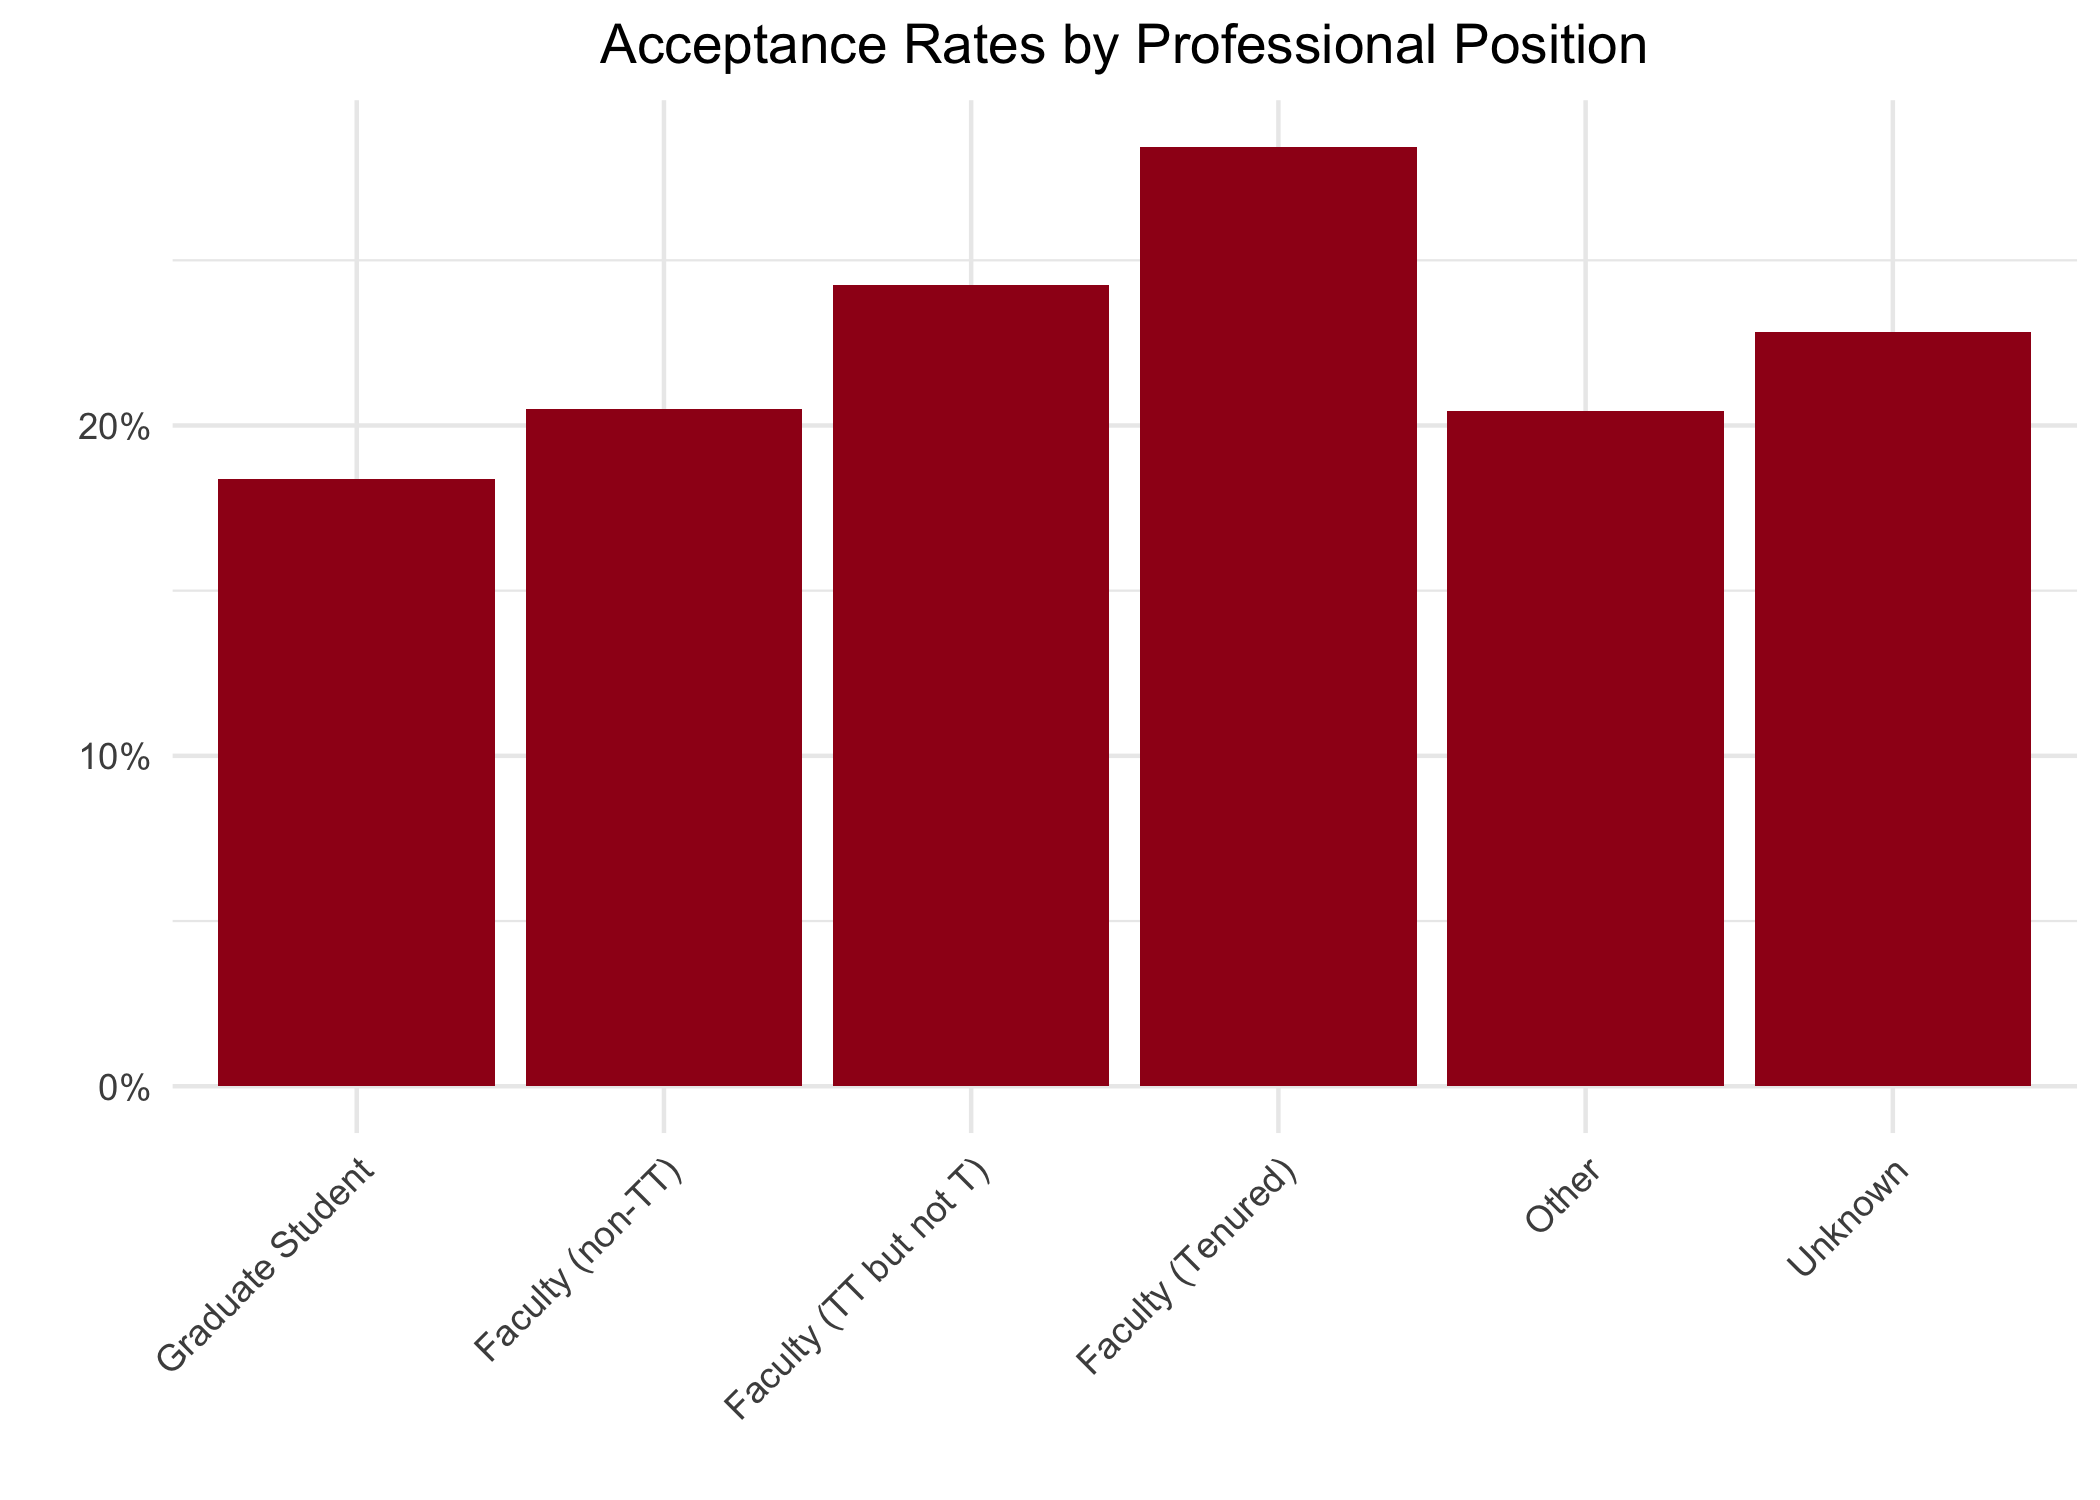
Compared to grad students, tenured faculty were about 10% more likely to report their papers as having been accepted.
Gender
About 79% of respondents specified their gender. Of those, 16.4% were women and 83.6% were men. How does this compare to journal-submitting philosophers in general?
Various other sources put the percentage of women in academic philosophy roughly in the 15–25% range. But we’re looking for something more specific: what portion of journal submissions come from women vs. men?
The APA/BPA report gives the percentage of submissions from women at 14 journals. And we can use those figures to infer that 17.6% of submissions to these journals were from women, which matches the 16.4% in the Journal Surveys fairly well.
Looking at individual journals gives a more mixed picture, however:
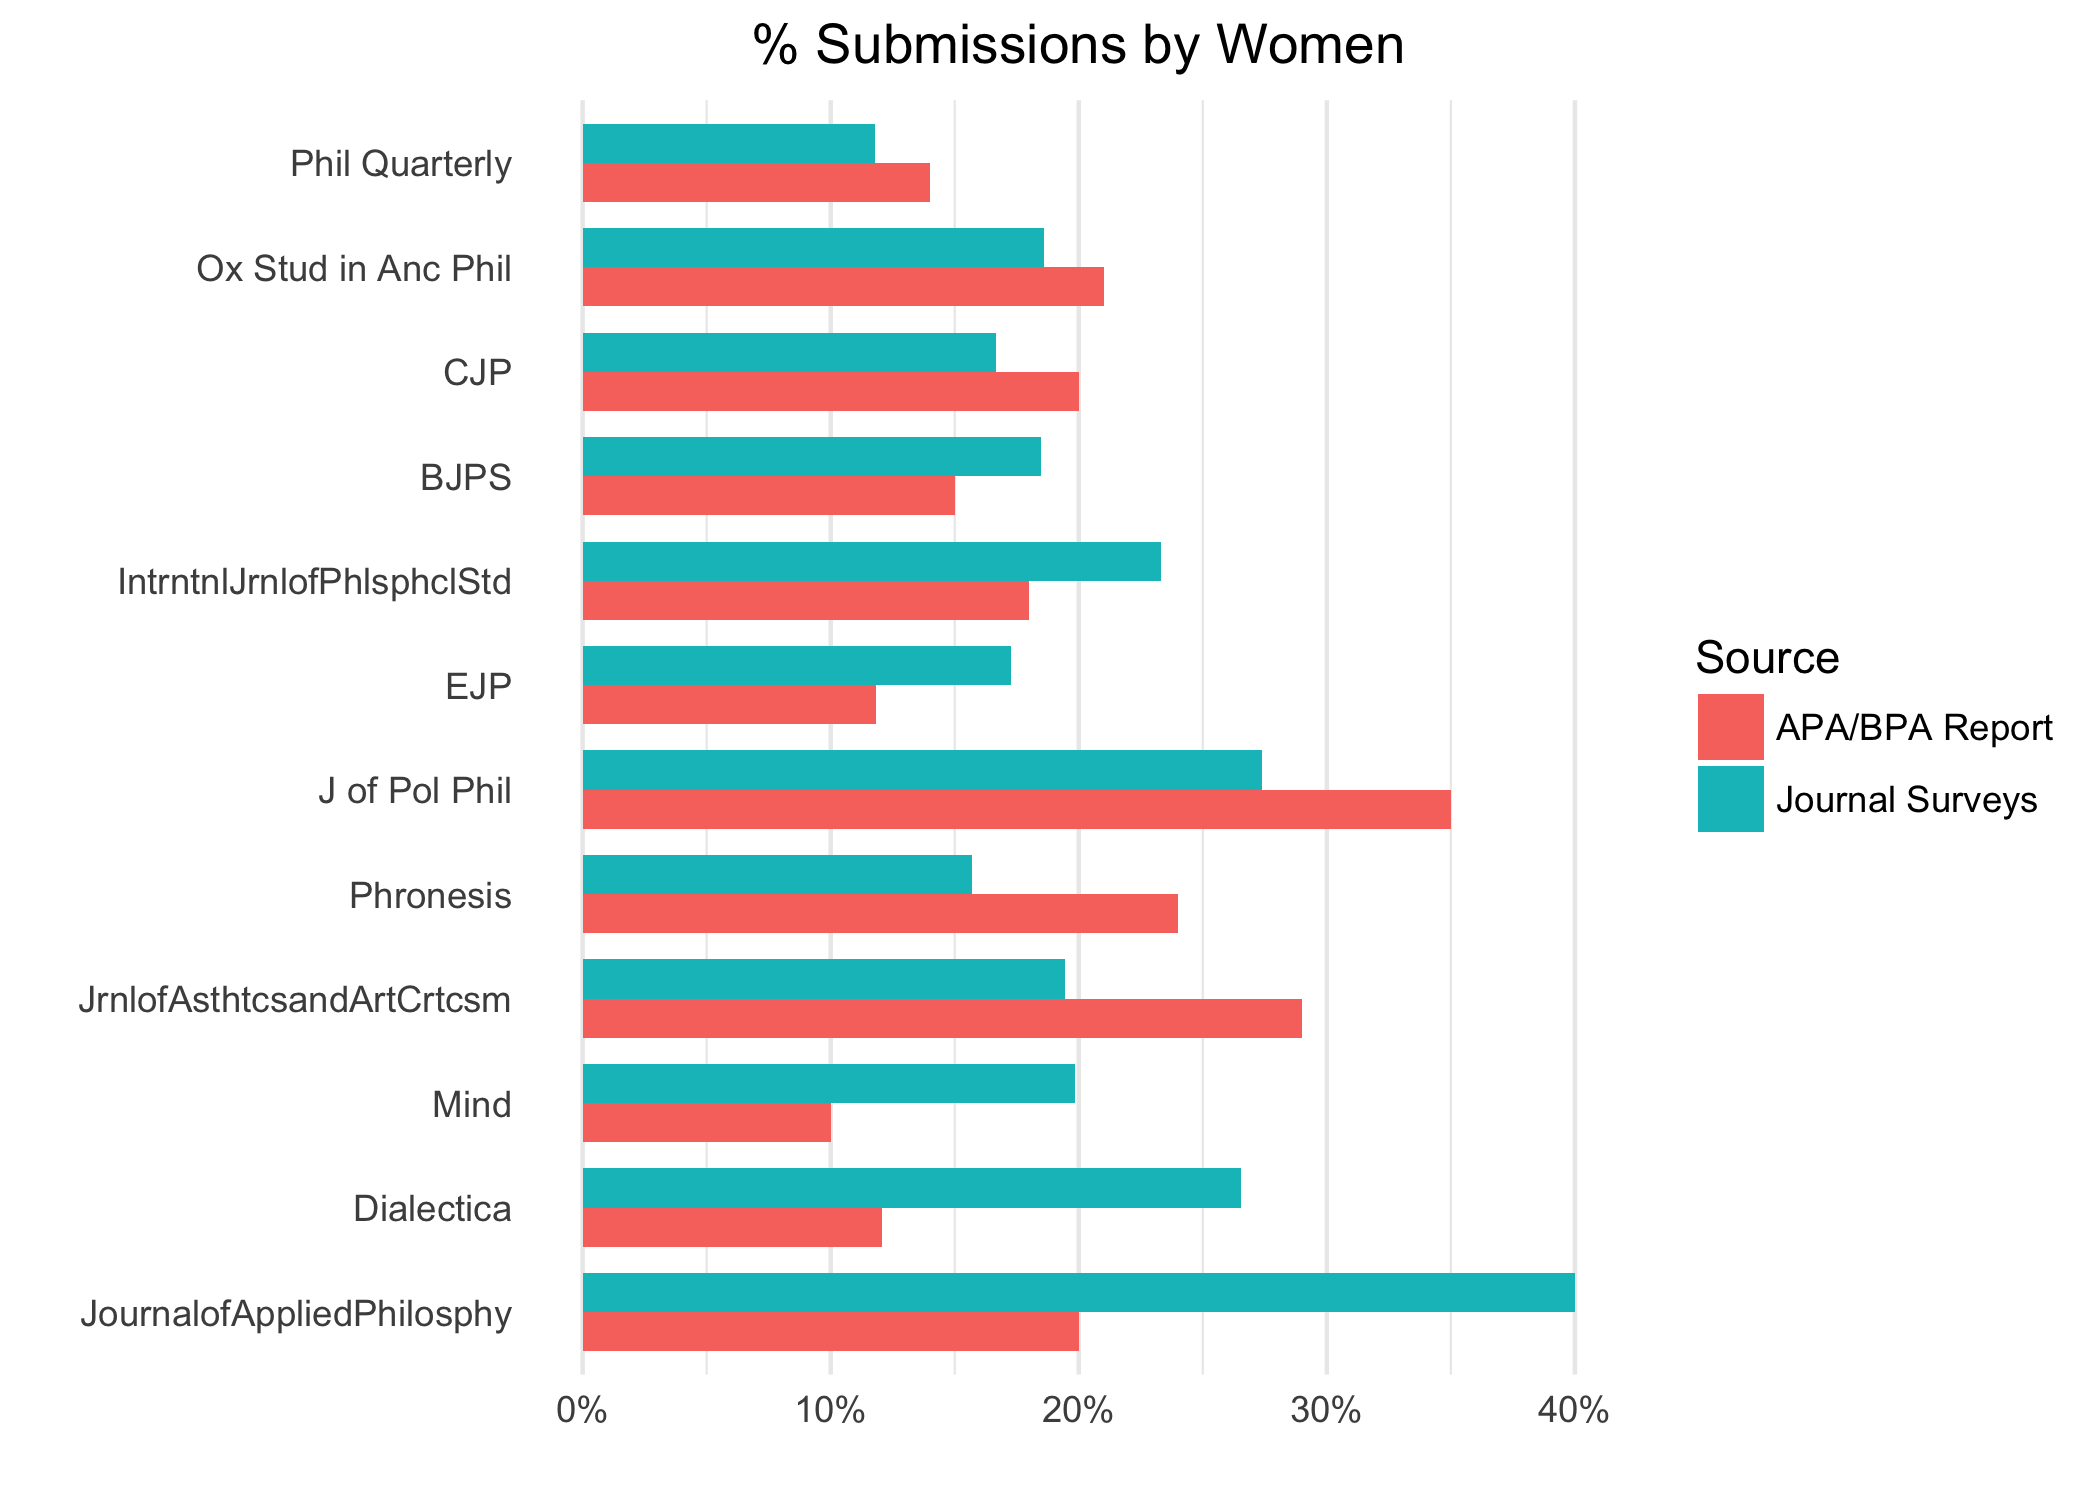
While the numbers are reasonably close for some of these journals, they’re significantly different for many of them. So, using the Journal Surveys to estimate the gender makeup of a journal’s submission pool probably isn’t a good idea.
Does gender affect acceptance? Looking at the data from all journals together, it seems not:
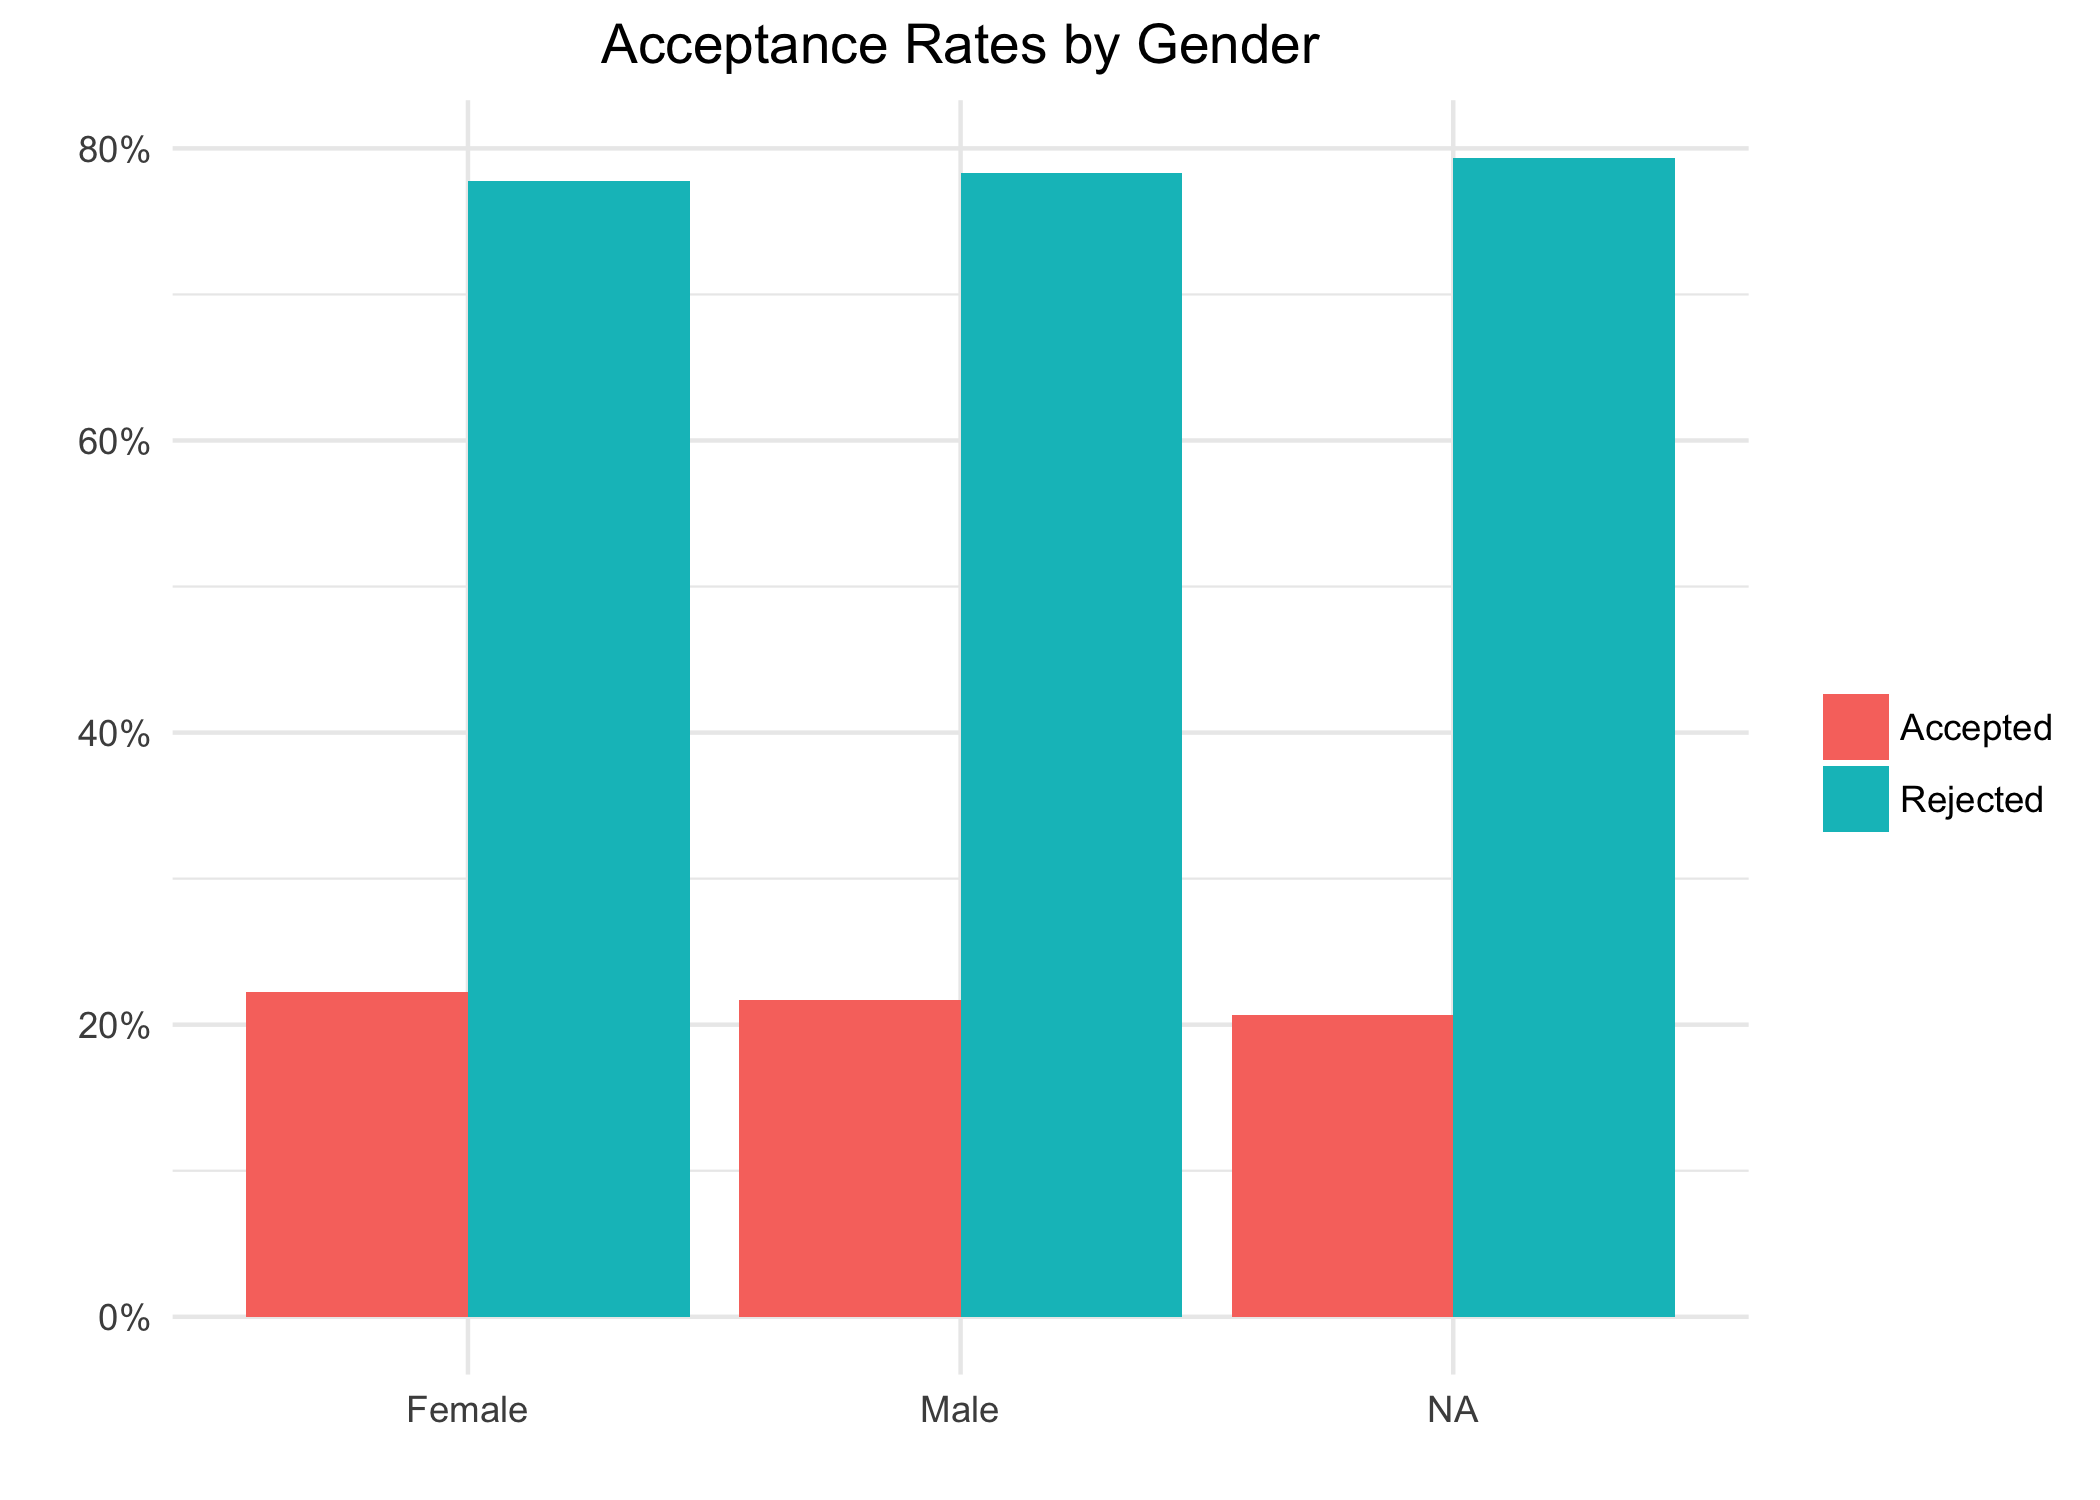
In fact it’s striking how stark the non-effect is here, given the quirks we’ve already noted in this data set.
We could break things down further, going journal by journal. But then we’d face the problem of multiple comparisons, and we’ve already seen that the journal-by-journal numbers on gender aren’t terribly reliable. So I won’t dig into that exercise here.
Wait Times
For me, the surveys were always most interesting as a means to compare wait times across journals. But how reliable are these comparisons?
The APA/BPA report gives the average wait times at 38 journals. It also reports how many decisions were delivered within 2 months, in 2–6 months, in 7–11 months, and after 12+ months.
Trouble is, a lot of these numbers look dodgy. The average wait times are all whole numbers of months—except inexplicaby for one journal, Ratio. I guess someone at the APA/BPA has a sense of humour.
The other wait time figures are also suspiciously round. For example, APQ is listed as returning 60% of its decisions within 2 months, 35% after 2–6 months, and the remaining 5% after 7–11 months. Round percentages like these are the norm. So, at best, most of these numbers are rounded estimates. At worst, they don’t always reflect an actual count, but rather the editor’s perception of their own performance.
On top of all that, there are differences between the downloadable Excel spreadsheet and the APA’s webpages reporting (supposedly) the same data. For example, the spreadsheet gives an average wait time of 6 months for Phil Imprint (certainly wrong), while the webpage says “not available”. In fact the Excel spreadsheet flatly contradicts itself here: it says Phil Imprint returns 73% of its decisions within 2 months, the rest in 2–6 months.
I don’t know any other comprehensive list of wait times, though, so we’ll have to make do. Here I’ll restrict the comparison to journals with 30+ responses in the 2011–2013 timeframe, and exclude Phil Imprint because of the inconsistencies just mentioned.
That leaves us with 11 journals on which to compare average wait times:
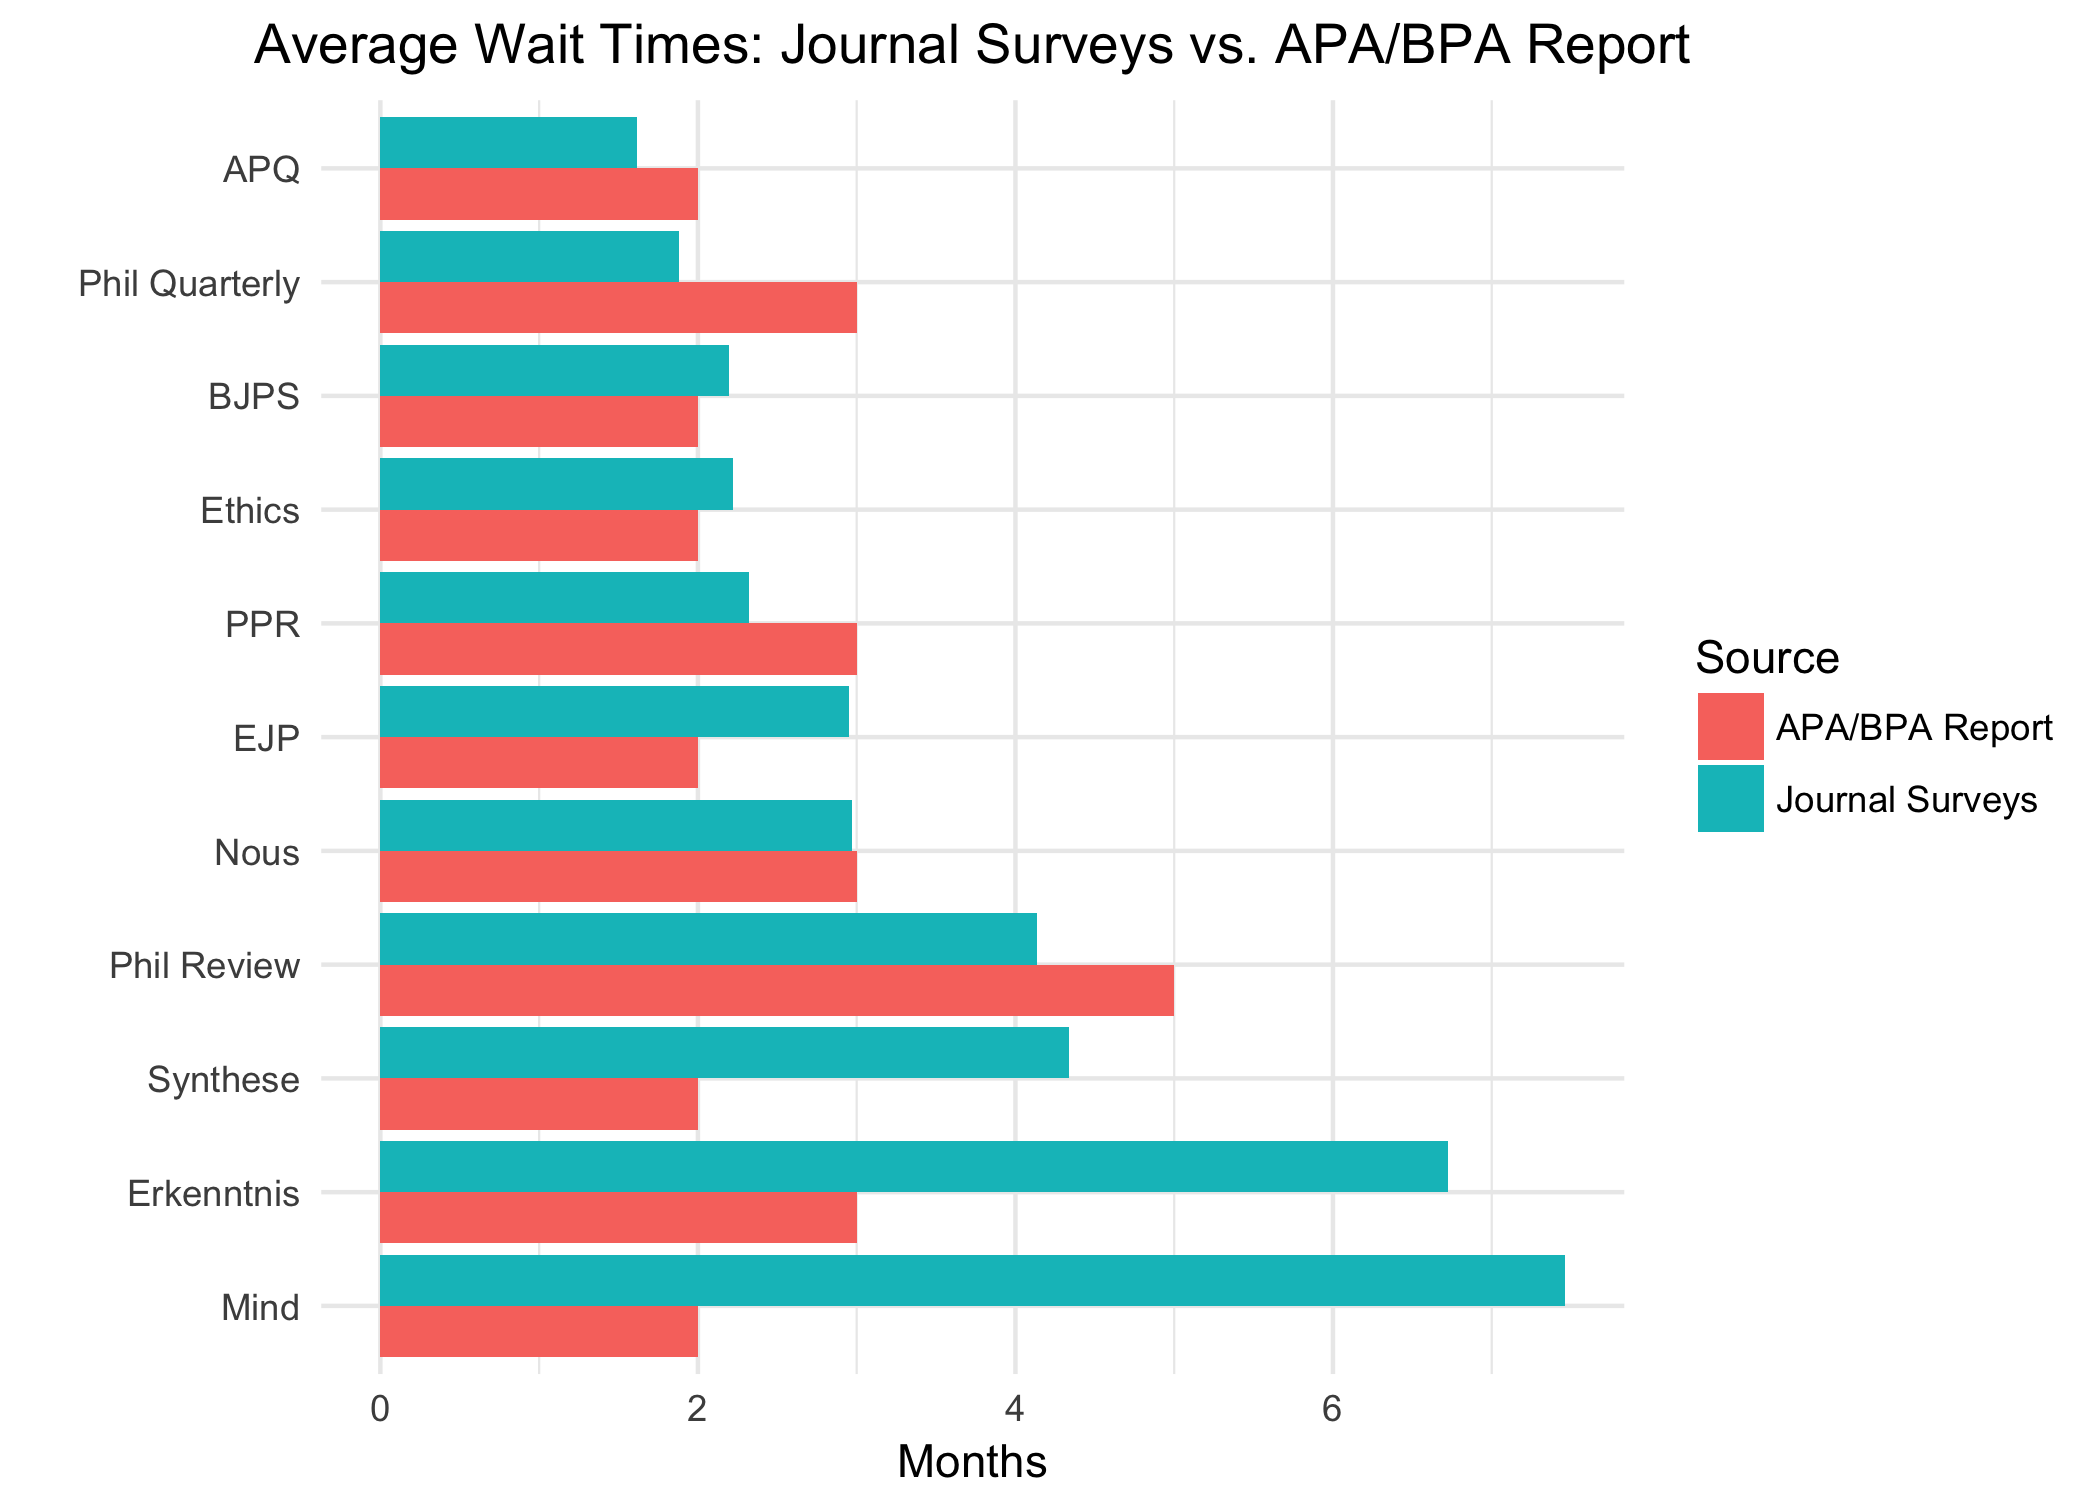
The results are pretty stark. The match is close for most of these journals. In fact, if we’re forgiving about the rounding, only three journals have a discrepancy that’s clearly more than 1 month: Erkenntnis, Mind, and Synthese.
Notably, these are the three journals with the longest wait times according to survey respondents. I’d add that the reported 2 month average for Mind is wildly implausible by reputation. I can’t comment on the discrepancies for Erkenntnis and Synthese, though, since I know much less about their reputations for turnaround.
I do want to flag that Mind has radically improved its review times recently, as we’ll soon see. But for the present purpose—validating the Journal Survey data—we’re confined to look at 2011–13. And the survey responses align much better with Mind’s reputation during that time period than the 2 month average listed in the APA/BPA report.
In any case, since the wait time data looks to be carrying a fair amount of signal, let’s conclude our analysis with some visualizations of it.
Visualizing Wait Times
A journal’s average wait time doesn’t tell the whole story, of course. Two journals might have the same average wait time even though one of them is much more consistent and predictable. Or, a journal with a high desk-rejection rate might have a low average wait time, but still take a long time with its few externally reviewed submissions. So it’s helpful to see the whole picture.
One way to see the whole picture is with a scatterplot. This also let’s us see how a journal’s wait times have changed. To make this feasible, I’ll focus on two groups of journals I expect to be of broad interest.
The first is a list of 18 “general” journals that were highly rated in a pair of polls at Leiter Reports.2 For the sake of visibility, I’ll cap these scatterplots at 24 months. The handful of entries with longer wait times are squashed down to 24 so they can still inform the plot.
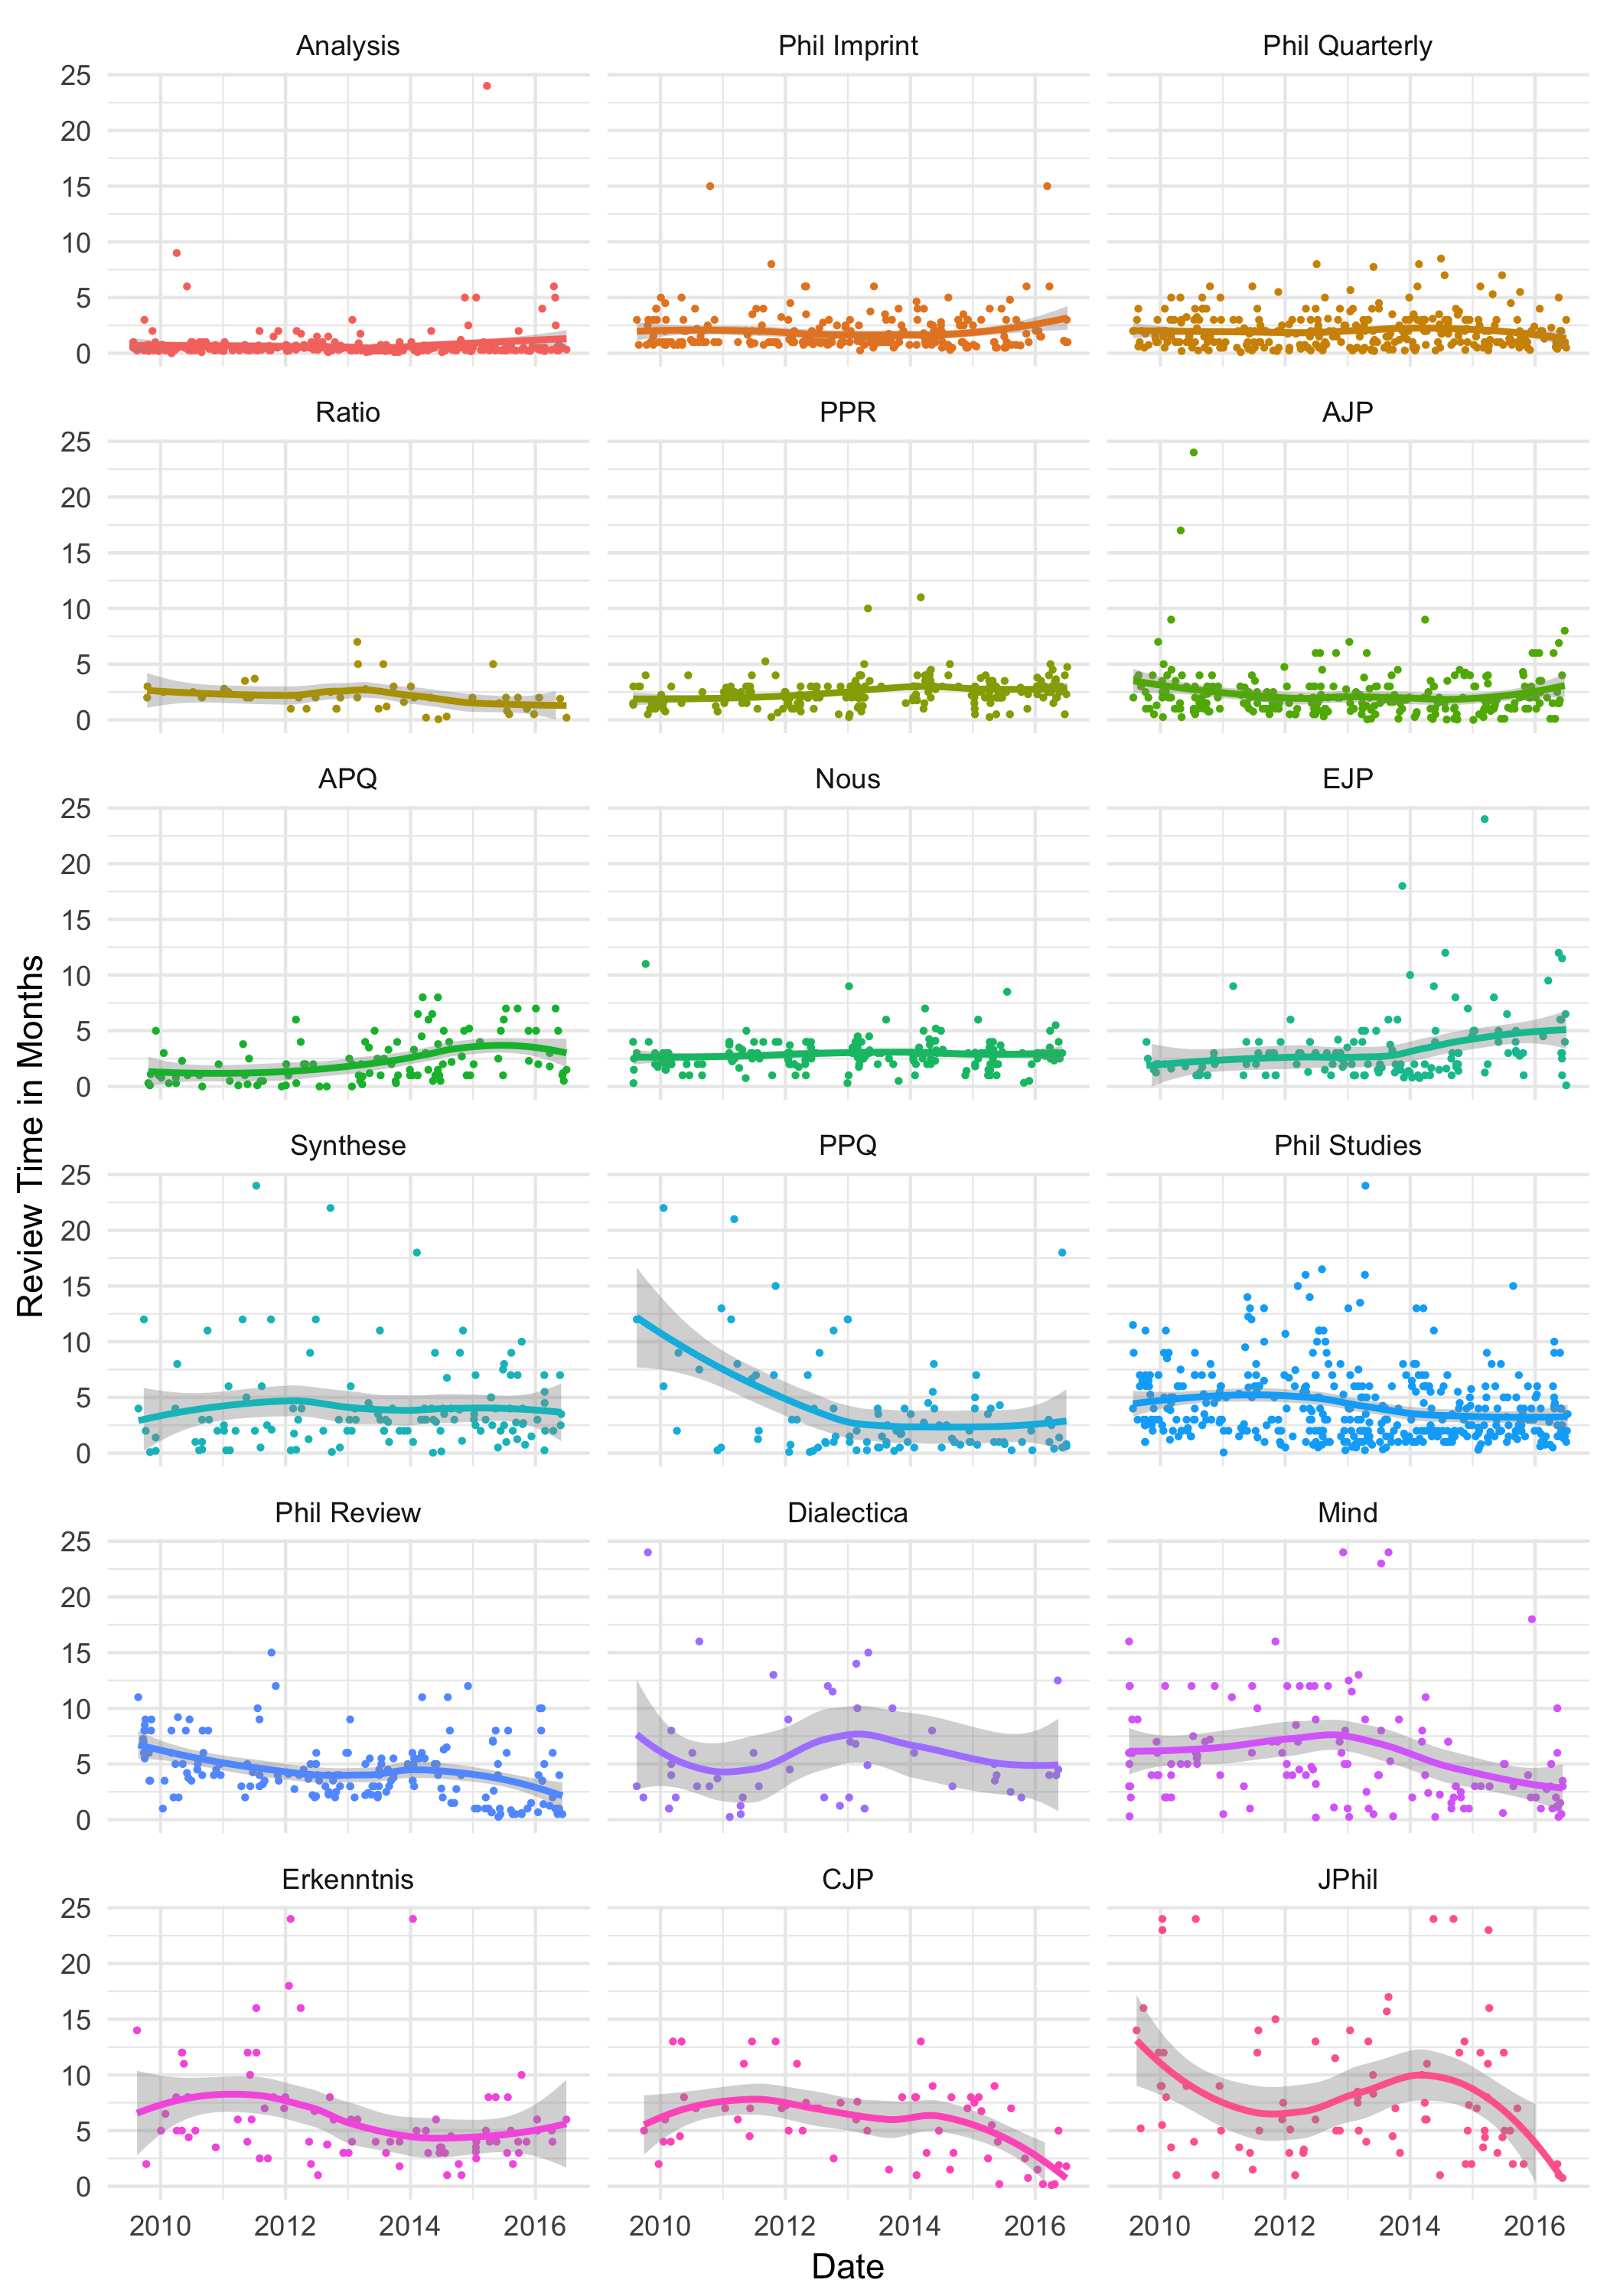
In addition to the improvements at Mind mentioned earlier, Phil Review, PPQ, CJP, and Erkenntnis all seem to be shortening their wait times. APQ and EJP on the other hand appear to be drifting upward.
Keeping that in mind, let’s visualize expected wait times at these journals with a ridgeplot. The plot shows a smoothed estimate of the probable wait times for each journal. Note that here I’ve truncated the timeline at 12 months, squashing all wait times longer than 12 months down to 12.
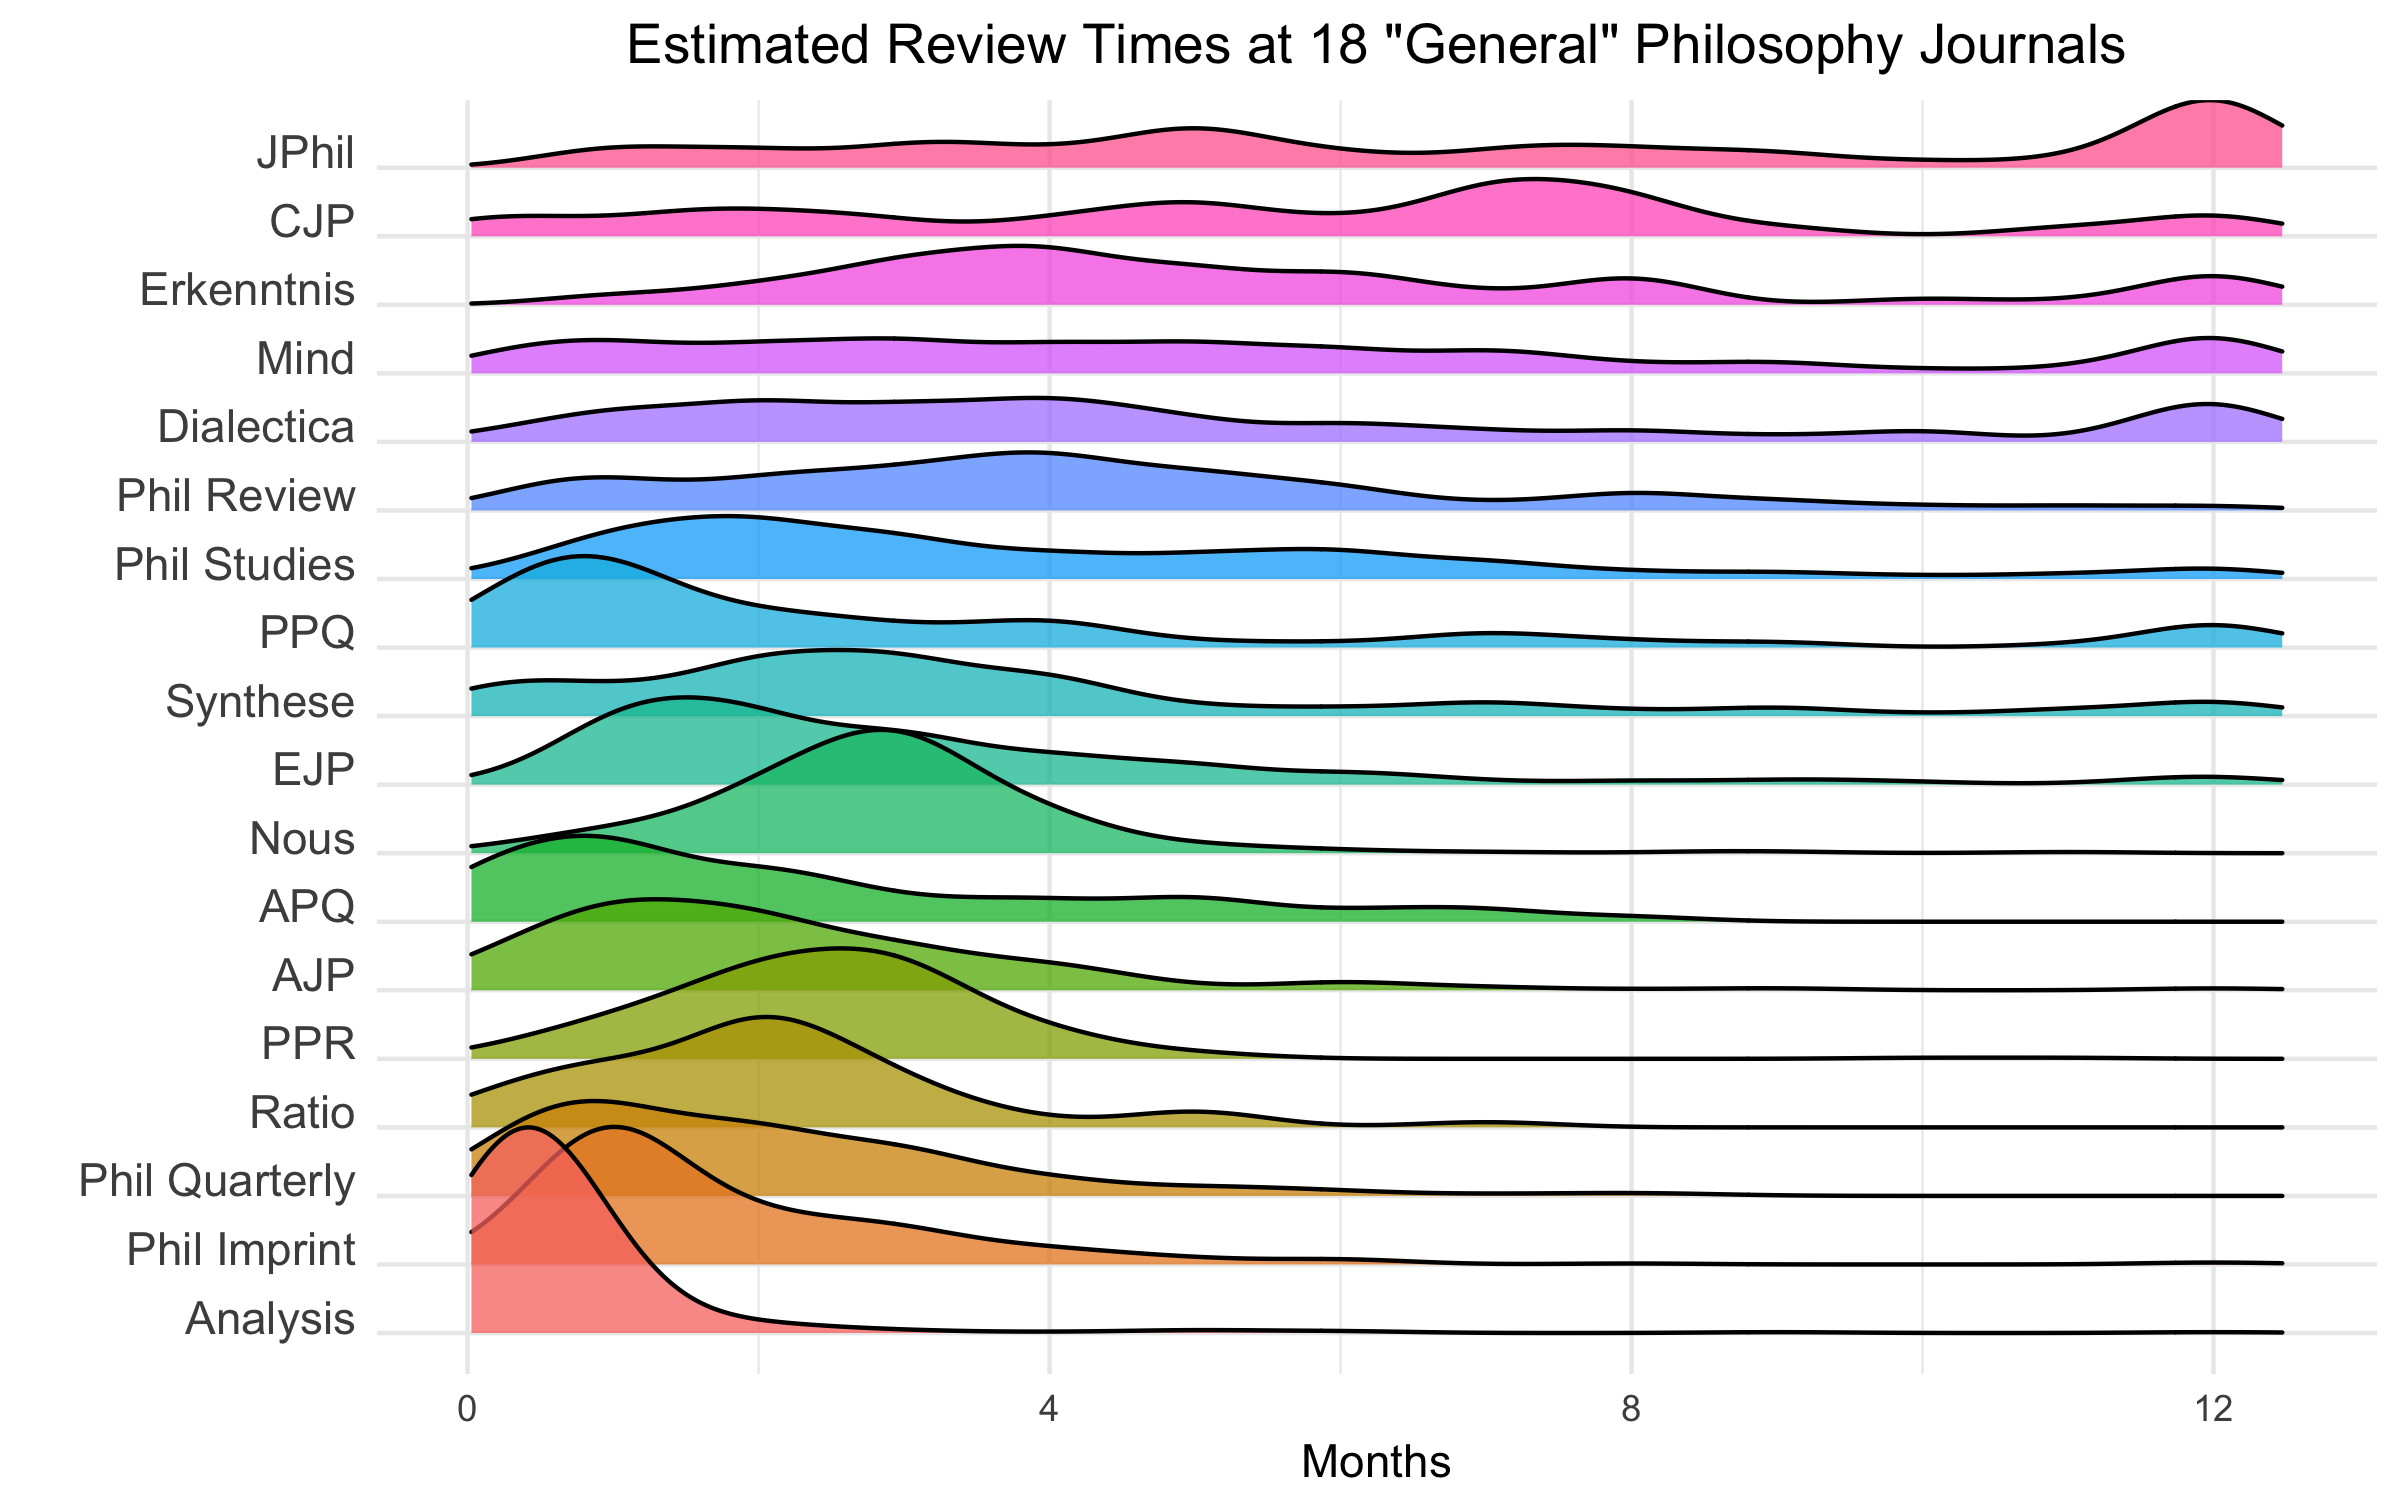
Remember though, the ridgeplot reflects old data as much as new. Authors submitting to journals like Mind and CJP, where wait times have significantly improved recently, should definitely not just set their expectations according to this plot. Consult the scatterplot!
Our second group consists of 8 “specialty” journals drawn from another poll at Leiter Reports. Here I’ll cap the scale at 15 months for the sake of visibility:
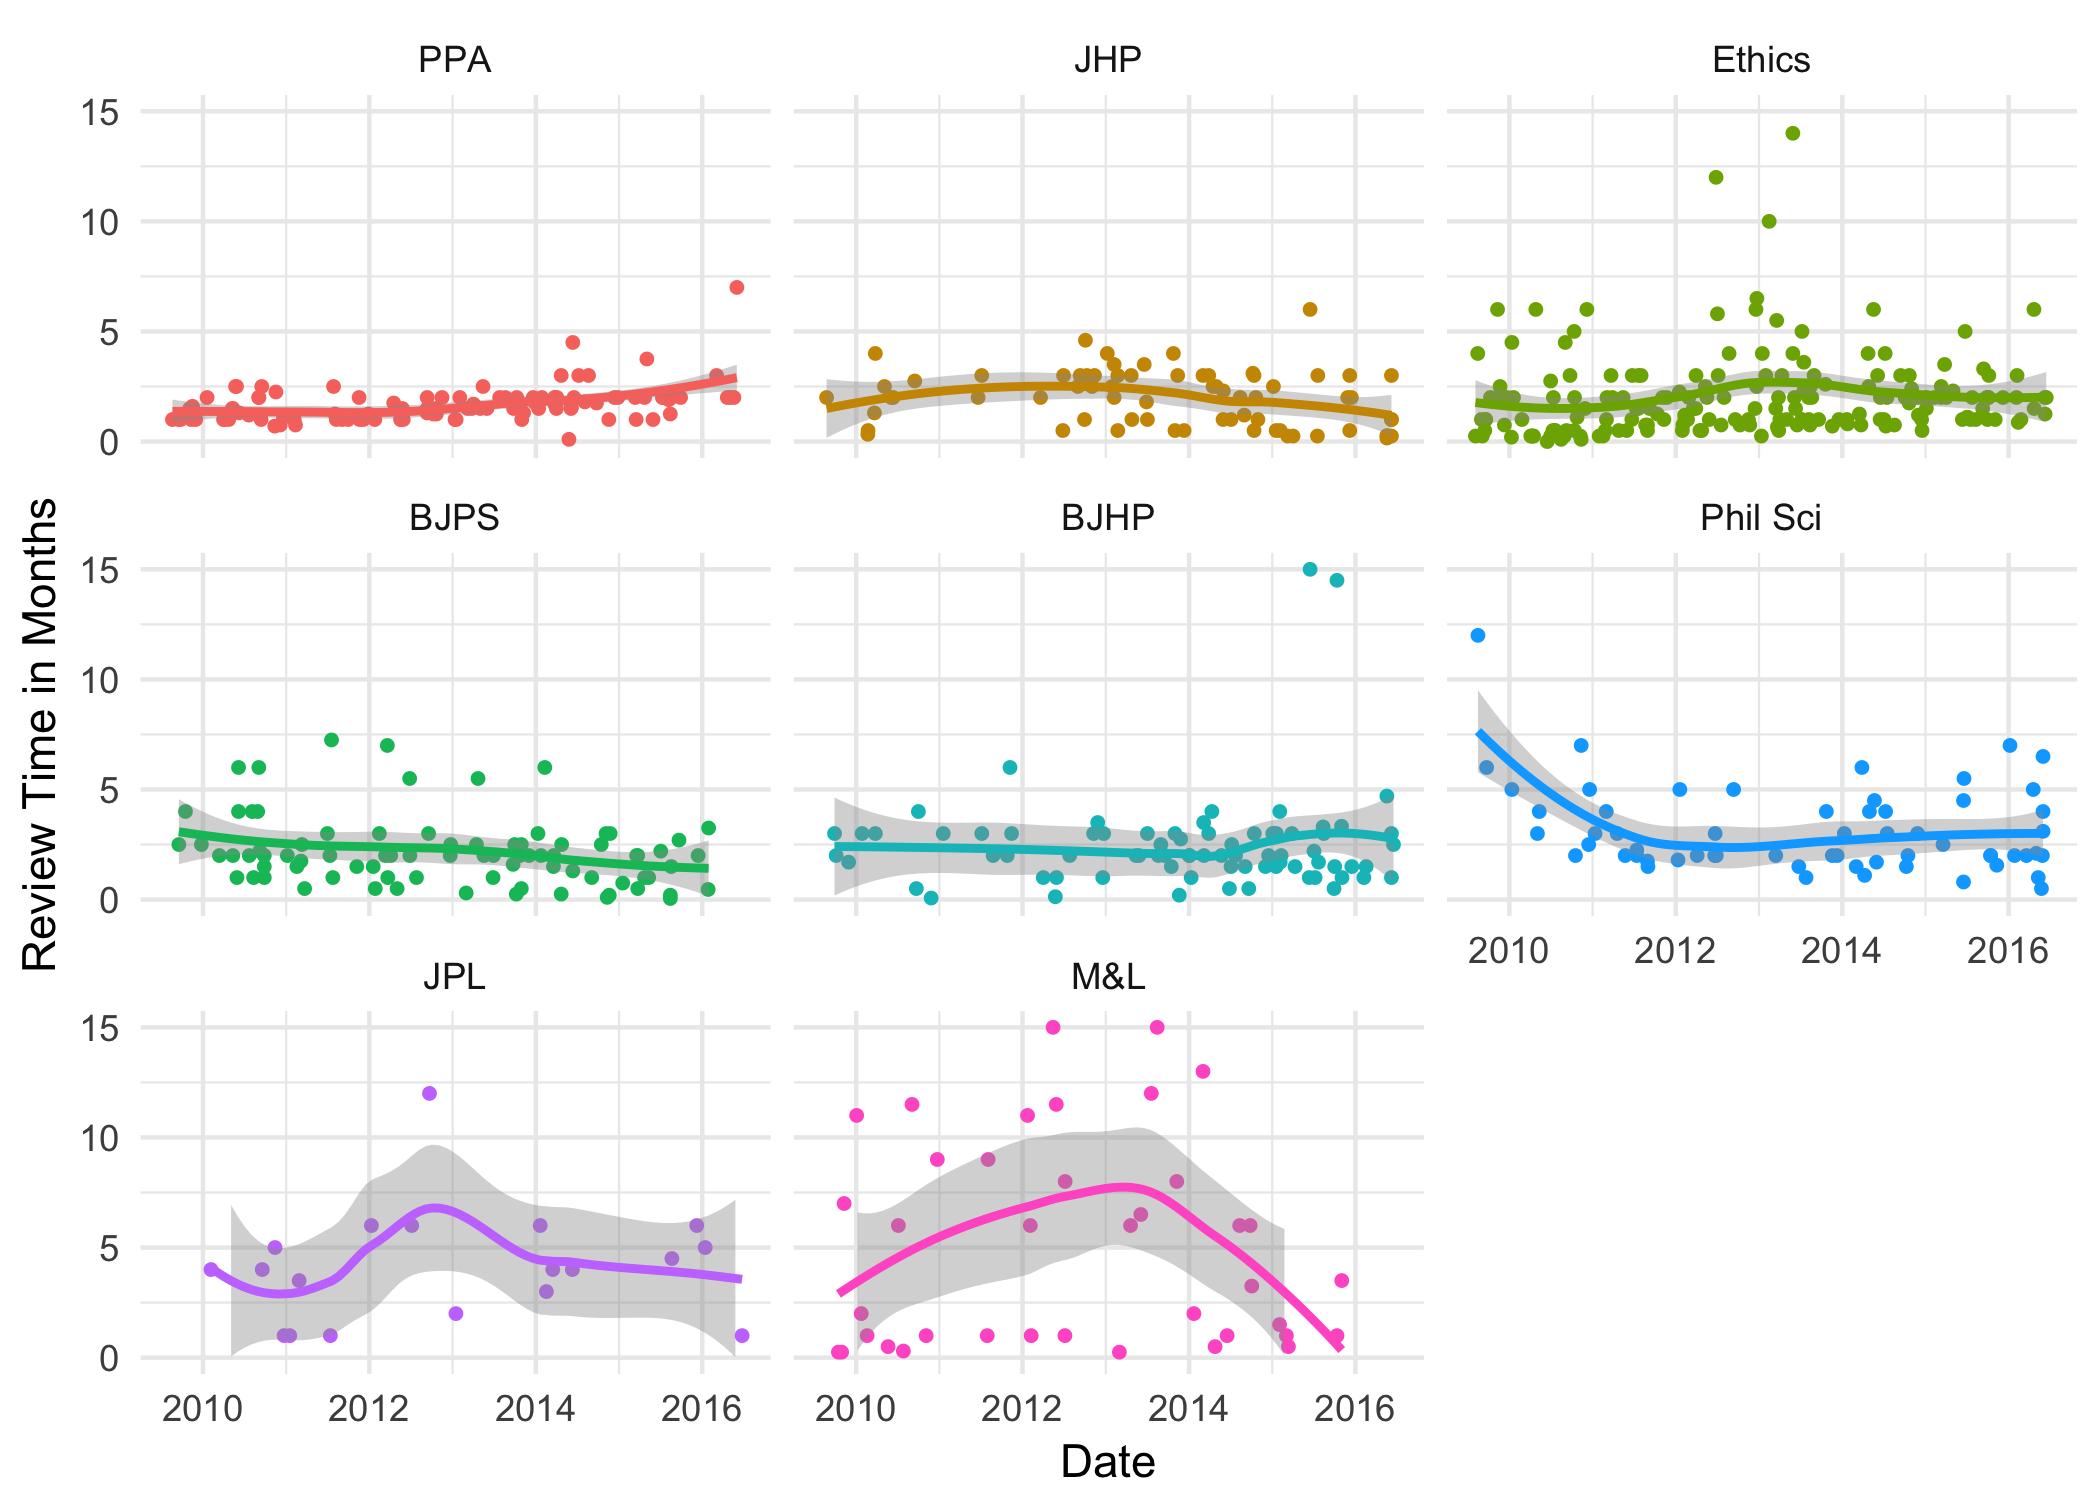
And for the ridgeplot we’ll return to a cap of 12 months:
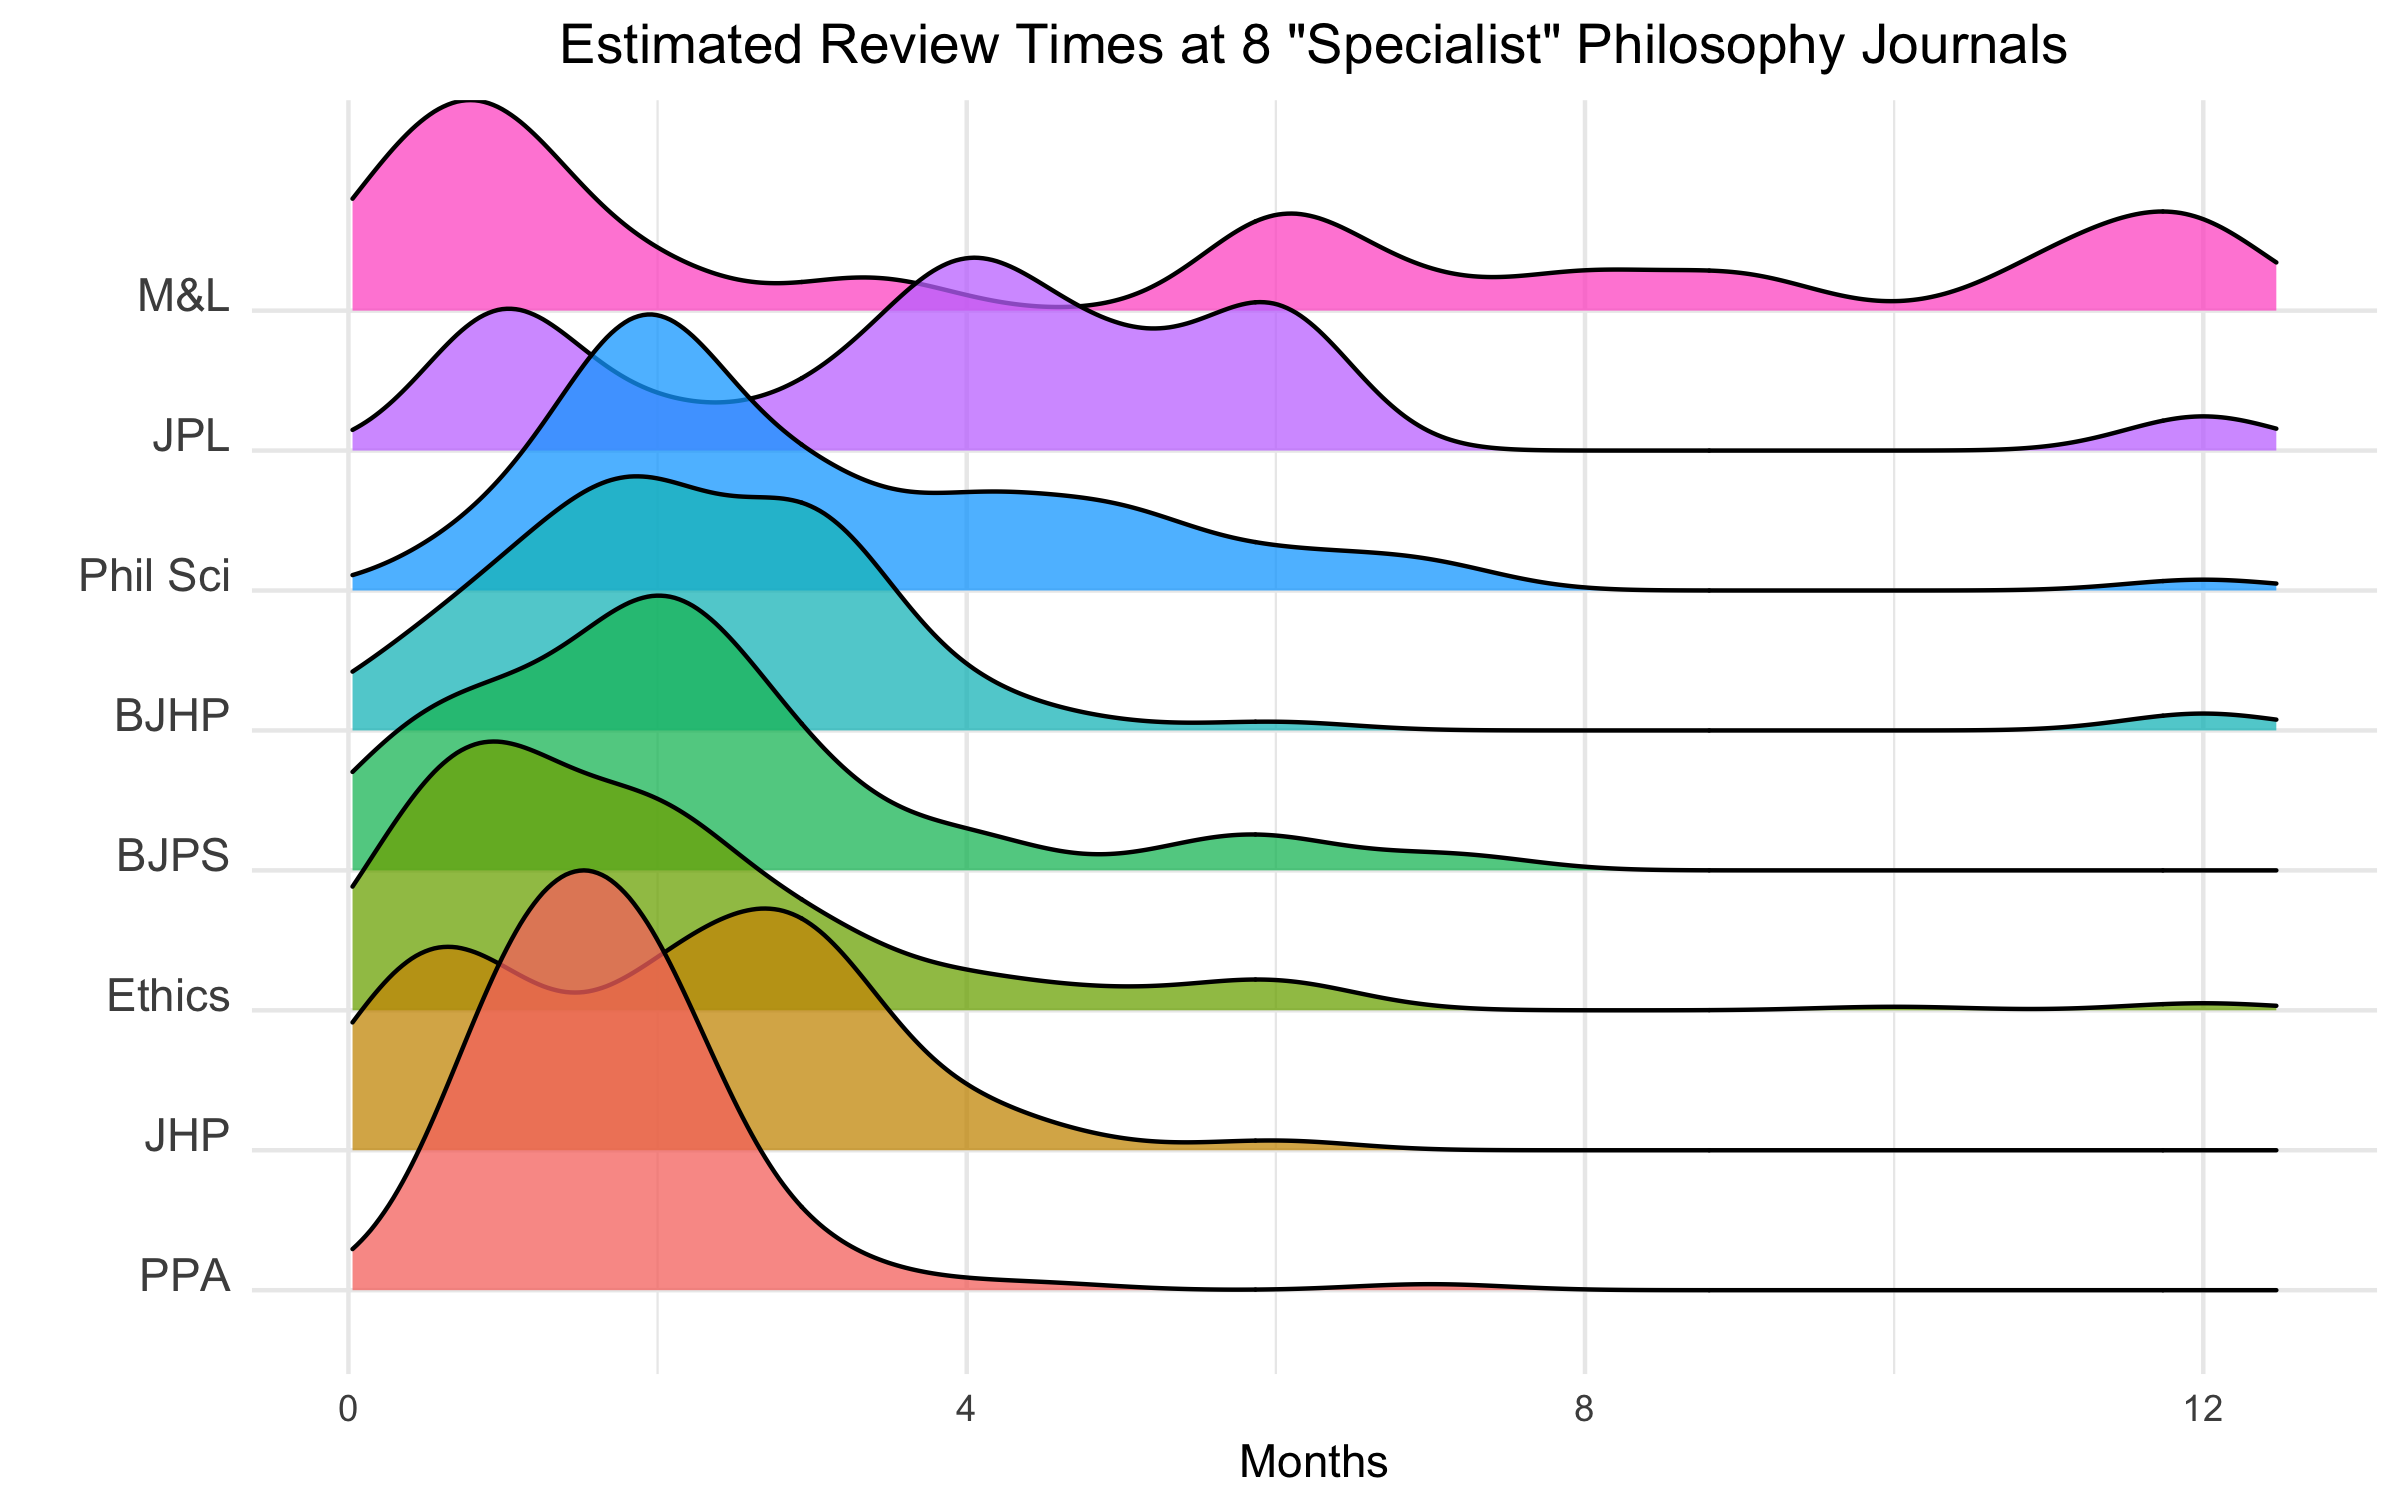
Again, remember that the ridgeplot reflects out-of-date information for some journals. Consult the scatterplot! And please direct others to do the same if you share any of this on social media.
Conclusions

- A journal’s prominence in the survey is a decent comparative guide to the quantity of submissions it receives.
- Accepted submissions are overrepresented in the survey. Acceptance rates estimated from the survey will pretty consistently overestimate the true rate—in many cases by a lot.
- Grad students and non-tenured faculty use the surveys a lot more than tenured faculty.
- Acceptance rates increase with seniority.
- Men and women seem to be represented about the same as in the population of journal-submitting philosophers more generally.
- Gender doesn’t seem to affect acceptance rate.
- The Survey seems to be a reasonably good guide to expected wait times, though there may be some anomalies (e.g. Synthese and Erkenntnis).
- Some journals’ wait times have been improving significantly, such as CJP, Erkenntnis, Mind, PPQ, and Phil Review.
- Sources: the APA/BPA study, Daily Nous, and the websites for Phil Review and Ethics. One notable exception is CJP, which reported 17% to the APA/BPA but 6% on Daily Nous. The ESF gives 10%. [return]
- The poll results identified 20 journals ranked “best” by respondents. So why does our list only have 18? Because 3 of those 20 aren’t covered in the survey data, and I’ve included the “runner up” journal ranked 21st. [return]